
|
T.03 Signals Wed 7/01 - 4 signal(s) |
T.03 Plus Signals Wed 7/01 - 7 signal(s) |
6S Signals Wed 7/01 - 10 signal(s) |

|

|
|
|
TradeCraft Updated Jul. 01 |
S&P | CRUDE | GOLD
S&P-Picture Perfect Despite
What you Think
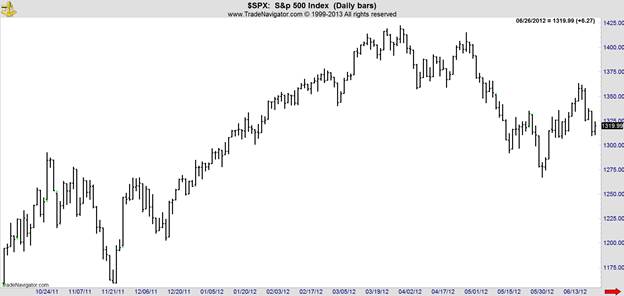
Markets are orderly, rational and sometimes predictable. This has been our mantra at the Danielcode for many years and that statement often comes as a shock to traders struggling with the vicissitudes of daily bars changing direction and appearing to have a mind of their own. In fact all markets do have a mind of their own but it is an intelligent mind that conforms to some standard trading rules. I am going to show you just how precise and orderly this important market is in reality which will likely conflict with your own preconceptions. And don't think you are alone. More comment is published about US Equity markets than the rest combined. Some is associated with seriously big names in the business and has the added gravitas of reputational weight. But, like much other analysis it is almost all wrong!! I acknowledge that much of the comment from the heavyweight worthies is designed to garner attention as much of this industry at the high end is more about self-promotion than serious analysis and our constant beat since 03/09 that "the trend is up and this market is heading for X target" certainly doesn't garner the gut wrenching attention and adrenaline fuelled emotion that "S&P will crash and go to 400" excites, firstly in the media and then by osmosis in the pit of your stomach. And that's sometimes why these worthies regularly (like every day) preach Armageddon scenarios. Perhaps some even believe it, but that thought is certainly less than charitable. Let's look at the view of this market that you probably have:
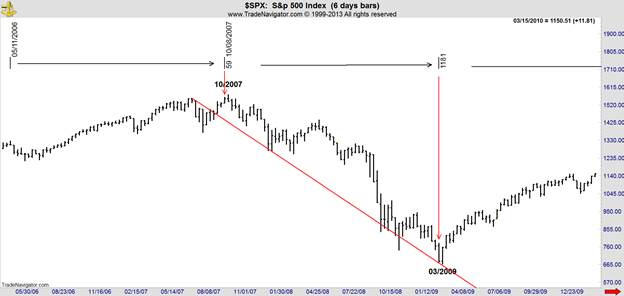
Up and down and choppy. Then up some more. Random turns and spirited runs followed by the inevitable pull back. The reason you have this view is that you are not using the correct tools to frame your view. And if you get closer, the view gets worse with apparent randomness filling your senses. In fact this market has been following a tight script as it always does, which is how the "sometimes predictable" part of our mantra remains. For the purpose of transparency and your edification, all of the techniques I am going to show you are explained and discussed at some length at our website www.thedanielcode.com where you will find many of my published articles and webinar videos under the appropriate tab. Some of the more demanding and complex work is taught at periodic tutorials, usually 3 days of teaching and a quota of fun in a pleasant regime. Let's start by converting this daily chart to our basic 6 day chart where each bar is created of 6 trading days. This is the basic Danielcode timing chart although we do not neglect the 12 day and even the 24 day chart for longer analysis. But let's for the moment focus on basic analysis and the creation of valid trade signals to get your blood pumping and keep the focus on a trader's prime task; making money. Always remember that our job as traders is not being right but making money. You will however find that getting the analysis right is the precursor to winning trades. The chart below is our basic 6 day timing chart. You can see the symmetry as S&P went 59 DC "weeks" (of 6 trading days to a DC week) from the 05/2006 high into the closing high for the entire move from the Dotcom crash on 10/2007. DC time and price recognition is valid at either a bar high/low or on the close and the 2007 top was the latter case. From there the market started its inexorable subprime correction which despite assurances from our putative masters that subprime is contained etc continued seemingly unabated for 17 months. This correction eventually saw all sorts of financial instruments blow up and in the fullness of time became "The Global Financial Crisis", a rather cute label for an event that was neither financial or a crisis. It was in fact merely an exposition of too much debt in households, institutions and government as is still unfolding now. This time the unrestricted urges of our real masters the pollies (politicians) to kick the can down the road with bailouts, bailins, QE 1 to infinity, central bank largess on likely dud securities to the chosen and every other accounting obfuscation that you can conjure, has set the stage for a rerun of that dreaded plague reality. At all costs, we the people must be shielded from that monster!! But that's another story which is not due to play out for quite a while.
59 is the dominant time cycle for tops in the
Danielcode lexicon and occasionally these time cycles (there are basically 4 of
them) switch to mark other important junctures. From the 2007 top coming
exactly on its DC 59 cycle (10/08/07 week gave us the closing or momentum
high), the run down to the 03/2009 low took exactly 59 DC weeks. so equal time
or as our hero Daniel recorded under instruction "it shall be for time, times
and an half". And so it was, which enabled me to call the 2009 low to the day
and a few ticks. Fortunately I was running a tutorial in New Zealand over that
weekend so I had a good few witnesses to us buying the low on Monday's open. I
say fortunately as although it was a singular event in the midst of real fear
and loathing at the time, requiring a high degree of commitment, time has
warped the memory so that every commentator on earth and a good few others
claim to have had the same vision simultaneously. Such is the way of the world. If you would like to revist those heady days (as
futures traders we trade both long and short and both pay just the same) you
may wish to read my article "The Number of the Beast". The number we were
looking for to end this exciting plunge down? 666. Having noted the repetition of important time cycles
you will note also the red line on the chart above, which on face value is
simply a line joining a high to the low of the first major rally after the top.
When you look at any chart you are seeing several different types of
measurement or "Degrees". The X or vertical axis measuring price is the 1st
Degree; the Y or horizontal axis measuring time is the 2nd Degree;
Volume is the 3rd Degree and the 4th Degree is an angle
which combines time and price. Most of these angles provide mere support and
resistance but the red line has another vital characteristic. It meets this
market at an expiring 59 DC time cycle shown on the chart as 118 or the 2nd
iteration of the initial 59 cycle, but is of course also 59 DC periods from the
2007 top. At these points where time and price sublimely meet, we say that
"Time and Price are Squared". And where time and price are squared a
significant turn is almost inevitable. We call this particular variation of an
angle The 4th Seal. If markets are rational and orderly as I claim, we
should be able to define present and future price action in a mathematical way.
To do this we use a standard regression channel, available in most charting
packages but add a few fixed rules all of which are discussed in some detail in
the Videos section at the Danielcode website, and in particular we substitute
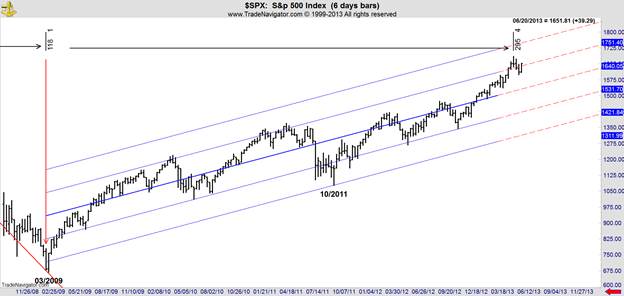
the most important of the DC ratios for 1 standard deviation from the mean. Let's look at the same chart with a correctly drawn DC
trading channel added:
The darker blue line is the median of the DC trading
channel with the lines above and below it being respectively 1 and 2 DC
standard deviations from the mean or 1.593XSD. From its 2009 low S&P index
has run precisely within 1SD above and below its mean with the complex
correction ending 10/2011 targeting 2SD with a degree of precision. So for the
past 51 months a simple mathematical formula has defined, contained and
forecast the operating range of this most complex of markets. Picture perfect. And there is more. Much more.
The final point of notice on the above chart is the
expiration of the 295 DC week cycle in the 6 day period ending 05/24/2013 which
caused the recent top. This is shown as 4 iterations of the DC 59 cycle from
the 03/2009 low and is of course the 5th iteration of this cycle
from the 2007 high. This is what I call constancy and precision. All of these amazing numbers which control markets in
all time frames and in the 1st, 2nd and 4th
Degrees were first written a very long time ago by our mentor whose likeness
appears above. For the Gnostics, the painting is Michaelangelo's rendering of
Daniel in the Sistine Chapel. You can figure the timeline!! Now we can add the DC price extensions in blue and the
retracements in red and black and see at least a countertrend reaction from
many of them. Whilst this is primarily a timing chart and the daily and weekly
charts we create for members are much more precise, I suggest to you that
nothing we are seeing when viewing charts through the Danielcode prism, accords
with Random Walk Theory which saw its author's thesis supervised and approved
by two Nobel Laureates.
Far be it for a humble country lawyer to argue with such luminaries of the financial world, but you be the judge. Here's our 4th Seal website update from 05/27: last
update : 05/27/13 06:03:12 PM EST
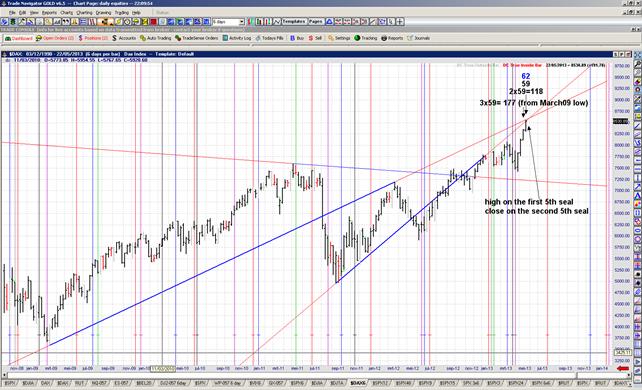
And just to show that all markets are ruled by the Danielcode, below is a DAX chart that I showed at a webinar on 05/23 the day of the recent high although the jury was still out on that day, forecast exactly by the 5th Seal, the cousin of the red line we have discussed.
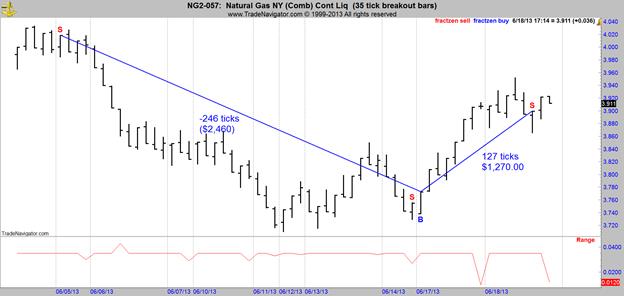
Given the fractal nature of markets, it follows that this form of analysis works much the same on daily charts. In fact our final offering for today is our proprietary FractZen chart of Natural Gas:
Using the same methodology as we have discussed this
intraday chart returned $2460 per 1 contract on the run down from 06/04 and so
far $1270 on the rally to 06/18 or $373 per day per 1 contract in just 1
market. This is not typical of intraday trading but does show the possibilities
in moving markets. I trust that this different take on market analysis has
sparked your interest enough to cause you to ask "Why is it so?" Rational
markets reward rational traders which is as it should be. The trick is to be
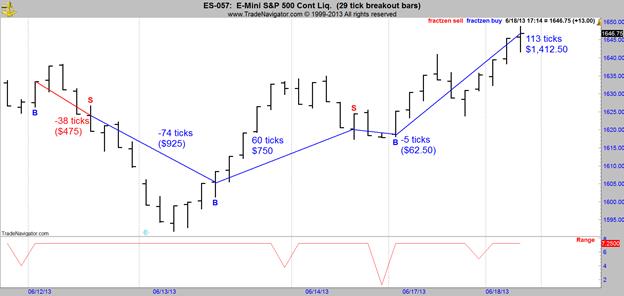
using the right looking glass. Our final chart for today is the intraday FractZen
chart for S&P Futures which takes our journey in this market from a 6 day
DC timing chart to an intraday trading chart. The winning trades are in blue
and the loser in red. Ignore the brackets as that's just a function of how
trade Navigator displays this feature which was likely designed for ever upward
stocks rather than trade both ways futures:
Again this is just 1 contract in 1 market but the
result is nice enough and supports my argument that good analysis makes good
trade signals. Before you try to emulate these FractZen charts, I should tell
you that they use a volatility algorithm to set the bar ranges and these change
almost every day. This is the current version. I invite you to visit us at the Danielcode website www.thedanielcode.com where the
articles, videos and PowerPoints will take you further on this journey of
discovery and hopefully allow you some insights into the orderly and purely
mathematical basis of market movement.
John Needham Sydney Australia 19 June 2013 "The fox knows many things, but the hedgehog knows one big thing. A Hedgehog Concept is not a goal, intention or strategy to be the best. It is an understanding of what you can be best at. The distinction is absolutely crucial". ~ Isaiah Berlin, The Hedgehog and the Fox | ||||||||||||||||||||


Disclaimer: All the reports, charts and content in the Danielcode web site are for educational purposes only and do not constitute trading advice nor an invitation to buy or sell securities. The views are the personal views of the author only and should be treated as such. Before acting on any of the ideas expressed, the reader should seek professional advice from a licensed broker in the appropriate jurisdiction.
Risk Disclosure for Front Page, Long Term Trend Charts: THE RISK OF LOSS TRADING COMMODITIES OR FUTURES CAN BE SUBSTANTIAL. COMMODITY TRADING HAS LARGE POTENTIAL RISKS, IN ADDITION TO ANY POTENTIAL REWARDS. YOU MUST BE AWARE OF THE RISKS AND BE WILLING TO ACCEPT THEM IN ORDER TO INVEST IN THE FUTURES OR COMMODITIES MARKETS. DON'T TRADE WITH MONEY YOU CAN'T AFFORD TO LOSE. THIS IS NEITHER A SOLICITATION NOR AN OFFER TO BUY OR SELL COMMODITY INTERESTS. THE USE OR PLACEMENT OF ANY STOP-LOSS OR STOP-LIMIT ORDERS MAY NOT LIMIT YOUR LOSSES AND YOU COULD LOSE MORE THAN YOUR INTENDED AMOUNT OF MONEY AT RISK. PAST PERFORMANCE OF ANY TRADING SYSTEM OR METHODOLOGY IS NOT INDICATIVE OF FUTURE RESULTS.
Risk Disclosure for Genie Results, T.03, T.03+ and TradeProgram: HYPOTHETICAL PERFORMANCE RESULTS HAVE MANY INHERENT LIMITATIONS, SOME OF WHICH ARE DESCRIBED BELOW. NO REPRESENTATION IS BEING MADE THAT ANY ACCOUNT WILL OR IS LIKELY TO ACHIEVE PROFITS OR LOSSES SIMILAR TO THOSE SHOWN; IN FACT, THERE ARE FREQUENTLY SHARP DIFFERENCES BETWEEN HYPOTHETICAL PERFORMANCE RESULTS AND THE ACTUAL RESULTS SUBSEQUENTLY ACHIEVED BY ANY PARTICULAR TRADING PROGRAM. ONE OF THE LIMITATIONS OF HYPOTHETICAL PERFORMANCE RESULTS IS THAT THEY ARE GENERALLY PREPARED WITH THE BENEFIT OF HINDSIGHT. IN ADDITION, HYPOTHETICAL TRADING DOES NOT INVOLVE FINANCIAL RISK, AND NO HYPOTHETICAL TRADING RECORD CAN COMPLETELY ACCOUNT FOR THE IMPACT OF FINANCIAL RISK OF ACTUAL TRADING. FOR EXAMPLE, THE ABILITY TO WITHSTAND LOSSES OR TO ADHERE TO A PARTICULAR TRADING PROGRAM IN SPITE OF TRADING LOSSES ARE MATERIAL POINTS WHICH CAN ALSO ADVERSELY AFFECT ACTUAL TRADING RESULTS. THERE ARE NUMEROUS OTHER FACTORS RELATED TO THE MARKETS IN GENERAL OR TO THE IMPLEMENTATION OF ANY SPECIFIC TRADING PROGRAM WHICH CANNOT BE FULLY ACCOUNTED FOR IN THE PREPARATION OF HYPOTHETICAL PERFORMANCE RESULTS AND ALL WHICH CAN ADVERSELY AFFECT TRADING RESULTS.