In the previous article of this series we discussed what the Danielcode is and how it helps us analyzing charts in a mathematical way based on the numbers of the DC matrix. More in depth information can be found on the Danielcode website under the articles tab. https://www.thedanielcode.com/display.php?nav=articles
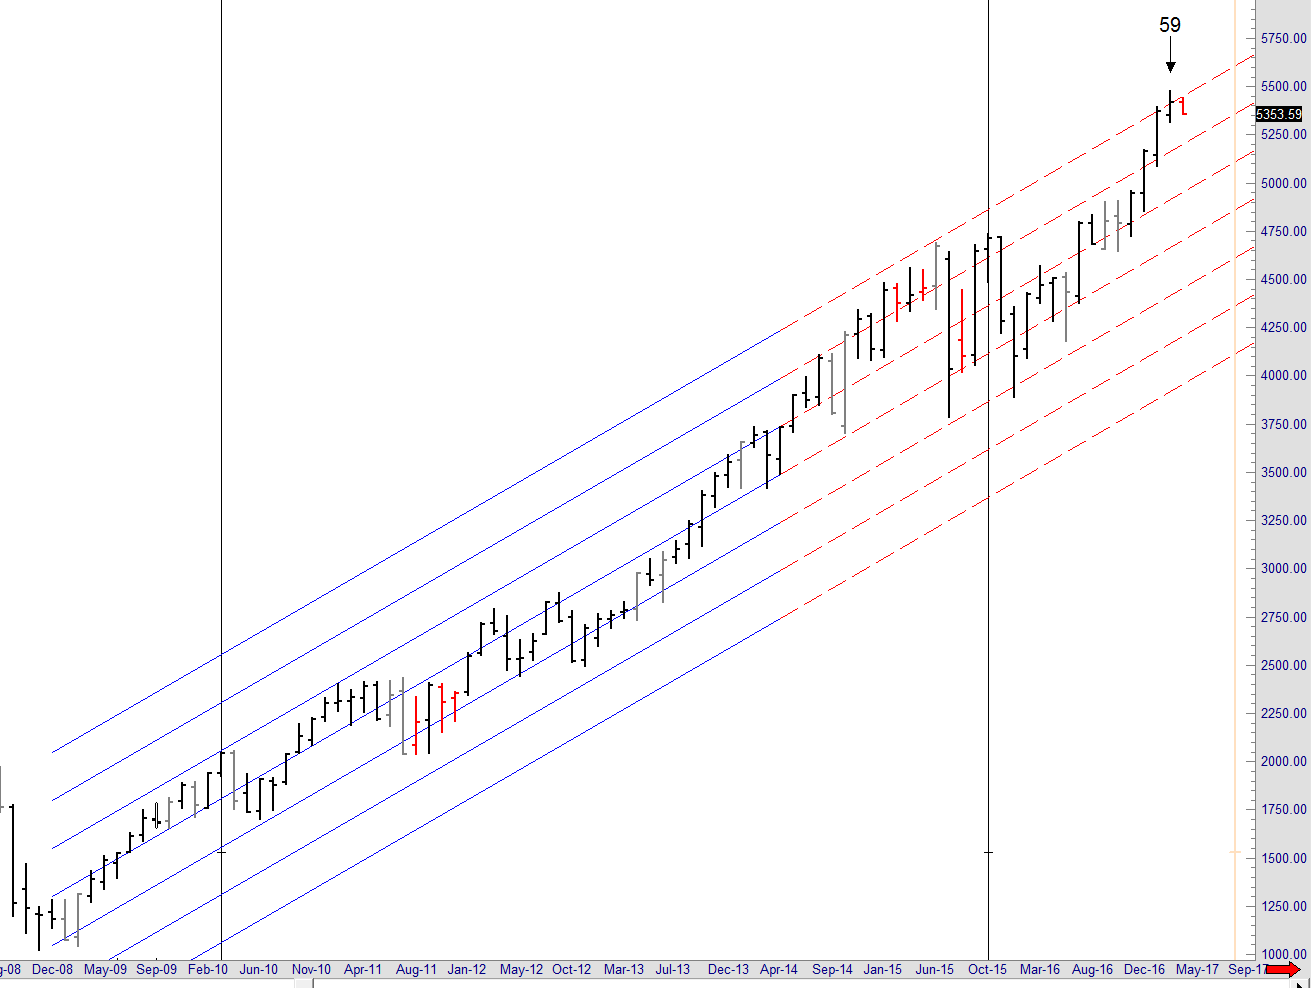
In April we issued a warning on the stock indexes based on a Danielcode 59 death cycle which was the present on the 24 day NDX chart. This is the chart that went with the article. It shows the NDX on a 59 death cycle running up against the 3rd standard deviation of the DC regression channel. This is a prime setup for a reversal for at least a good correction especially given the fact that market rarely exceed the 3rd standard deviation of this channel.
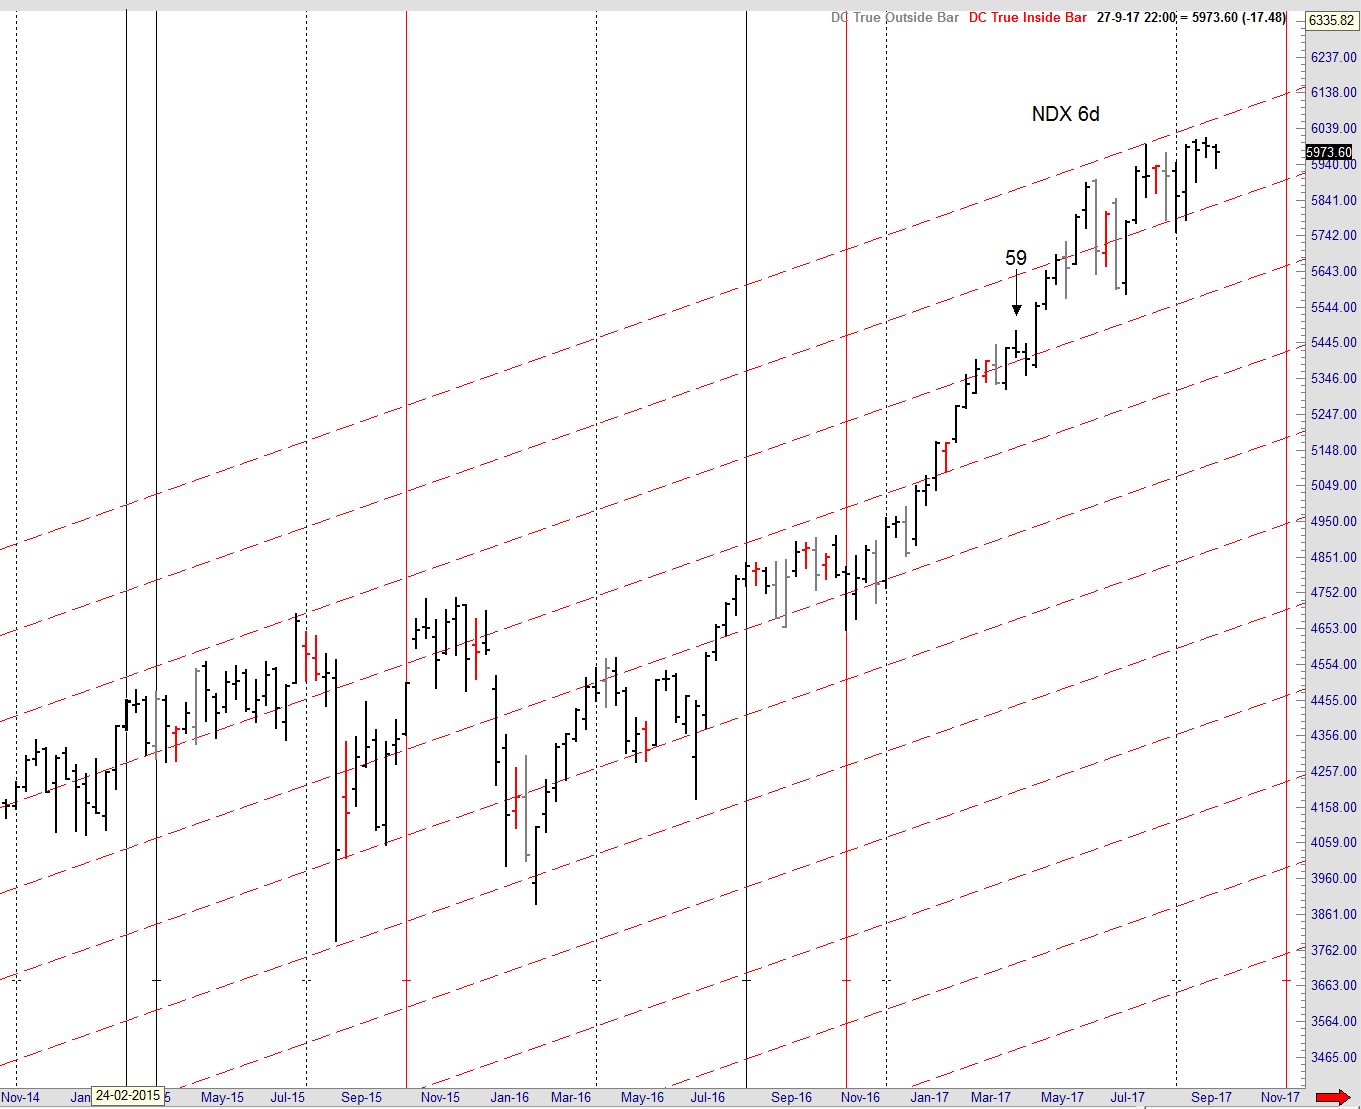
The next chart is a 6 day NDX chart with the same 59 cycle on it so we can see what happened on this cycle. And as you notice this cycle just gave us a 2 bar down correction into the next low and started the next leg up. And that is just the nature of a 59 cycle. We don’t know what kind of a turn to expect from it. It can be just a correction or it can be the end of a long term trend when we are dealing with a 59 death cycle. Death cycles need to expire from the first hop. And April this year was a perfect opportunity. Unfortunately not all 59 death cycles end the long term trend. But when they appear in a market at the 3rd Standard deviation of the long term DC regression channel we have to be on alert for the end of the trend. April did not take the opportunity because it just corrected 2 bars down before the next leg up started.
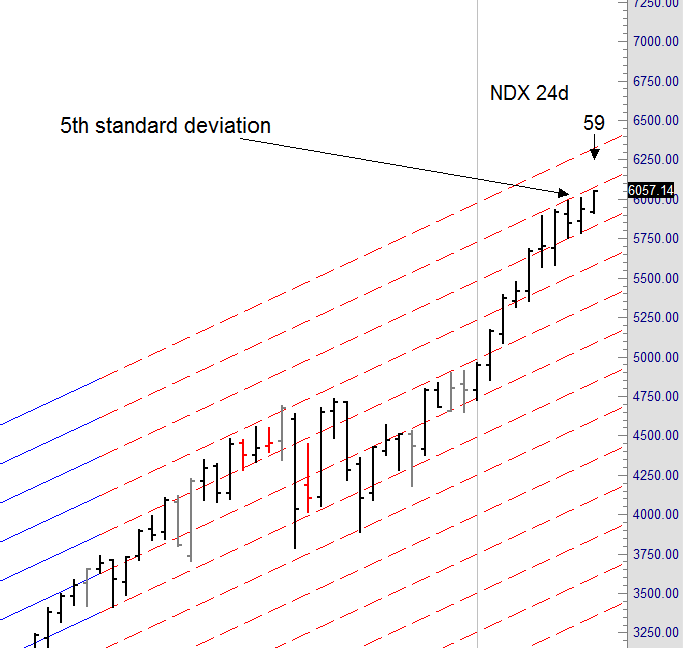
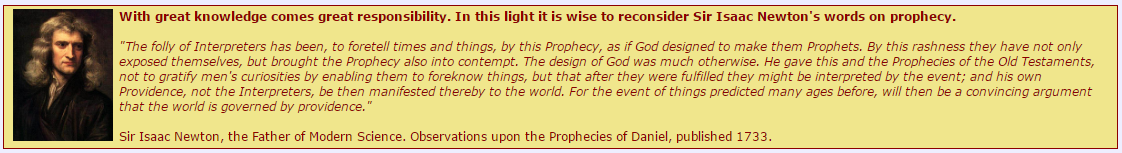
And some leg it was. The NDX is now trading at the 5th standard deviation of that same regression channel. And we thought April was extended. It makes me think of Isaac Newton’s famous quote at the end of the South Sea bubble in 1720 :
Sir Isaac Newton, 1721
I’m sure though that you are not reading this article to inform yourself what happened to NDX back in April or where it is trading today. It’s not our job to tell you what the market has done, in fact it’s quite the opposite. Knowing that sir Isaac Newton was a great student of the Bible and the Book of Daniel in particular it’s kind of ironic that he could not calculate the madness of men. Here at the Danielcode we do nothing else than calculate the madness of men and we do it solely base on the numbers of the Danielcode matrix.
Did you notice the 59 cycle on the previous chart? It’s running at this moment all the way through 10/31. And yes it is a death cycle. Know that Danielcode time cycles come with a +/- 1 period variance or error margin but are usually very precise. In fact when major turns are at hand or the market makes major moves it has a tendency to recognize the Danielcode numbers and Danielcode time cycles with extreme precision.
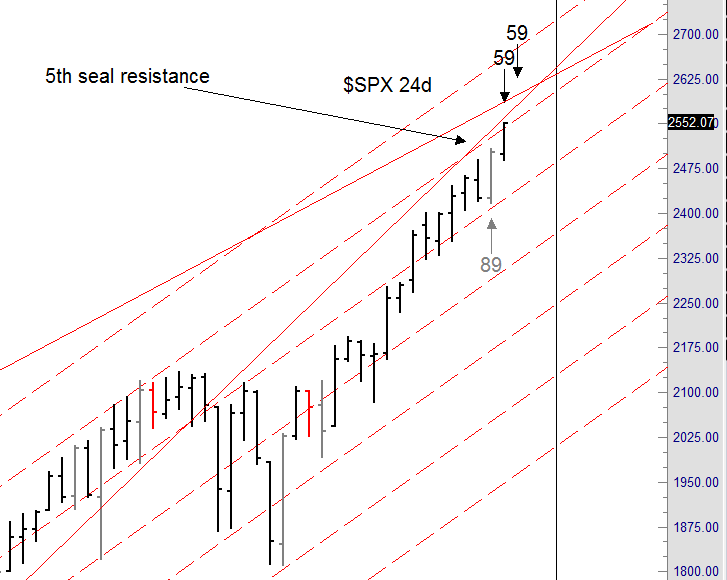
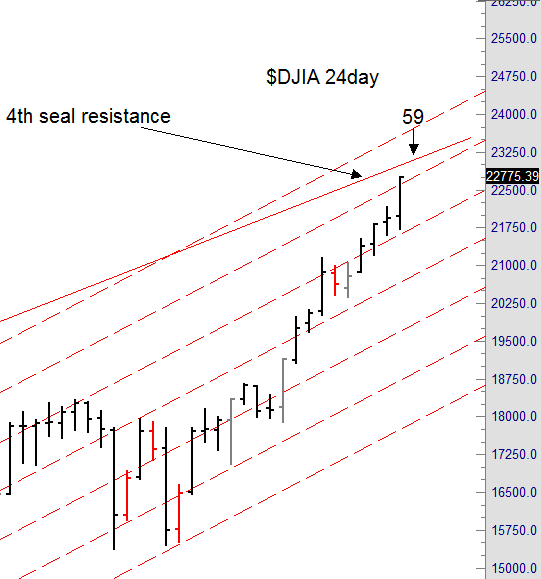
Let’s look at a few other charts. All of them are at important junctures like 4th and 5th seal resistance or some standard deviation of the DC regression channel and all have 59 death cycles dead ahead or already running.
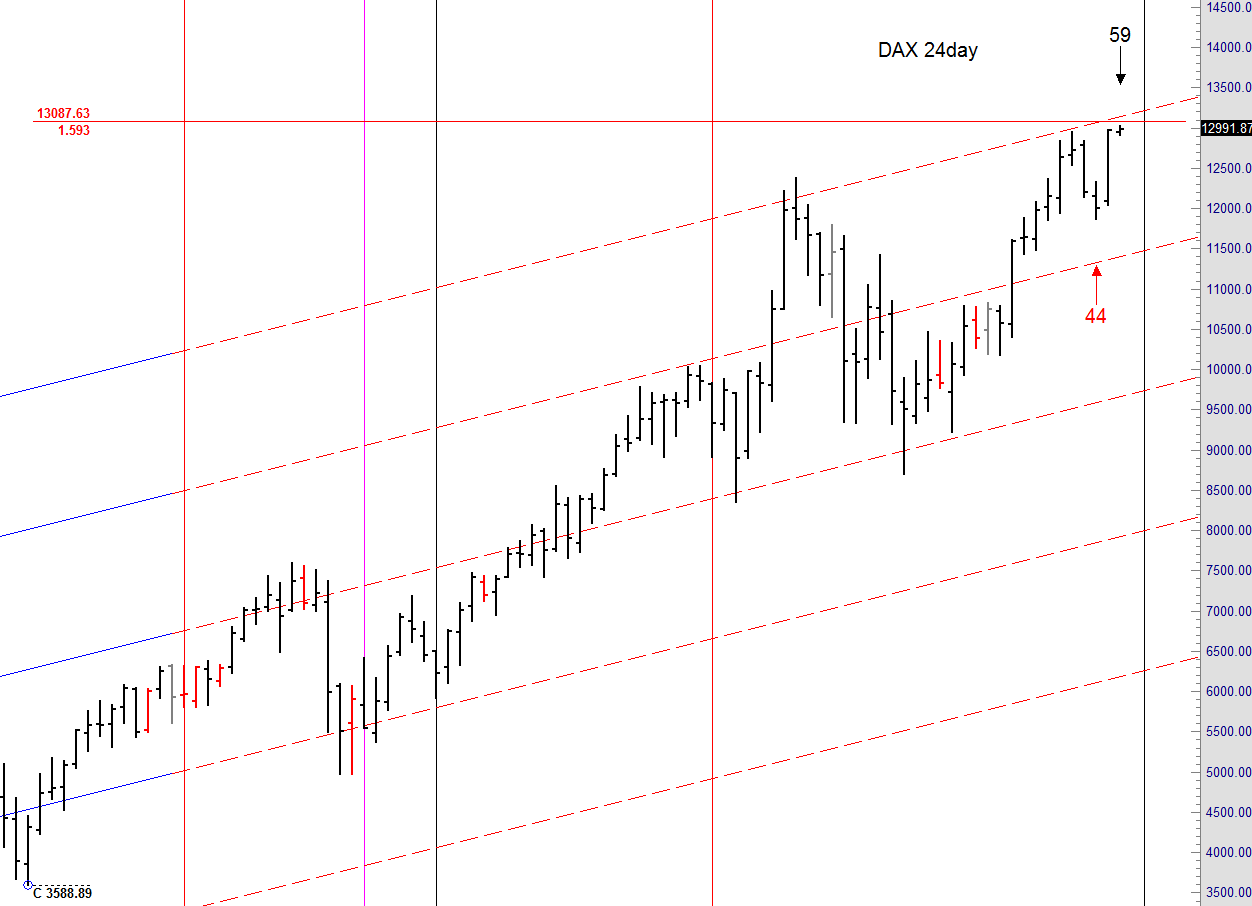
13087.63 here we come
We have some nice setups lining up in US equities but the most compelling chart in this article is the German DAX. There we have the perfect setup for a major inflection point in the making. Right now we have a 59 death cycle running in the DAX on the 24 day chart until 11/13. On the 6 day chart there is a 59 death cycle running from 10/13 until 10/20. But even more interesting is that whilst we are in a major DC time zone for a top the DAX is trading only a few points away from its major 1.593 extension level of 13087.63. This is the 2003 - 2007 rally extended 1.593 times from the 2009 low. Danielcode traders know very well how important the 59.3 number is. This is a very important DC extension which is close to being reached inside a very important DC time cycle.
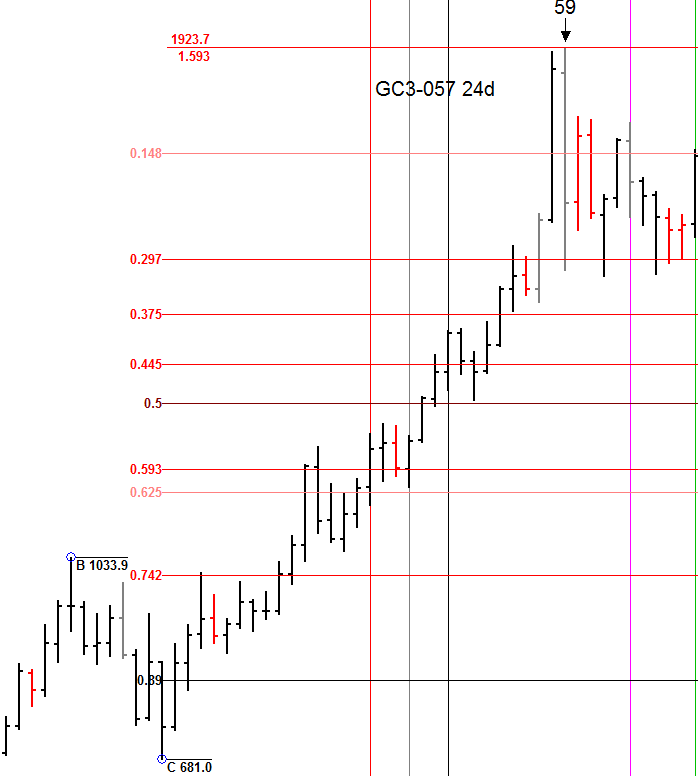
To illustrate how important this price level is I want to take you back to the 2011 top in gold. Remember when the gold futures contract topped in September of 2011? Back then the gold made it’s high at 1923.7 which is zero ticks away from the 1.593 extension in gold where the 1923.7 is exactly the 1999 low to the 2008 high extended 1.593 times from the later in 2008 low. And all of that happened on a 59 top cycle running during the month of September 2011. Precision to the tick in both time and price. We all know what happened afterwards.
We must remain cautious here. It has not happened yet. The DAX is not there yet. However if this market touches 13087.63 next week and reverses immediately it’s game on. And with ‘touches’ I mean recognize the number with the precision of a few ticks and then reverse course. If that happens within the current DC time zone I would say that this market is setup for a major reversal to the downside. What that does to US equites I don’t know. Europe tends to diverge with the US at major highs but given the similar time cycle setup in the SPX and DJIA and NDX I would say they are at equal important inflection points. On the 6 day charts of US equities the 59 cycles come a week later so maybe they get one more push after the potential DAX top. All eyes should now be focused on the DAX. This market is key in predicting the next move for global equities. It’s about to get very interesting. A few days ago I read something interesting from a guy I respect a lot. Never break the cardinal rule of market forecasting he said which is “give a direction or a time but never both!” I guess that makes me just another arrogant idiot. But I can assure you I’m very humble to mother nature and God’s providence. It’s has been a few years now since I was first exposed to the Danielcode and I can assure you that its hidden knowledge contains some very impressive forecasting capabilities. It’s all there on the Danielcode website waiting to be discovered.
jneedham@thedanielcode.com
support@thedanielcode.com
Happy harvesting days from the Belgium farmlands
Frank De Baere
John Needham is a Sydney Lawyer and Financial Consultant. He publishes The Danielcode Online and writes occasionally on other markets. He lives with his family in Australia and New Zealand. Please visit us at www.thedanielcode.com where there is much to learn.
"The fox knows many things, but the hedgehog knows one big thing. A Hedgehog Concept is not a goal, intention or strategy to be the best. It is an understanding of what you can be best at. The distinction is absolutely crucial". ~ Isaiah Berlin, The Hedgehog and the Fox
Disclaimer: All the reports, charts and content in the Danielcode web site are for educational purposes only and do not constitute trading advice nor an invitation to buy or sell securities. The views are the personal views of the author only and should be treated as such. Before acting on any of the ideas expressed, the reader should seek professional advice from a licensed broker in the appropriate jurisdiction.
Risk Disclosure for Front Page, Long Term Trend Charts: THE RISK OF LOSS TRADING COMMODITIES OR FUTURES CAN BE SUBSTANTIAL. COMMODITY TRADING HAS LARGE POTENTIAL RISKS, IN ADDITION TO ANY POTENTIAL REWARDS. YOU MUST BE AWARE OF THE RISKS AND BE WILLING TO ACCEPT THEM IN ORDER TO INVEST IN THE FUTURES OR COMMODITIES MARKETS. DON'T TRADE WITH MONEY YOU CAN'T AFFORD TO LOSE. THIS IS NEITHER A SOLICITATION NOR AN OFFER TO BUY OR SELL COMMODITY INTERESTS. THE USE OR PLACEMENT OF ANY STOP-LOSS OR STOP-LIMIT ORDERS MAY NOT LIMIT YOUR LOSSES AND YOU COULD LOSE MORE THAN YOUR INTENDED AMOUNT OF MONEY AT RISK. PAST PERFORMANCE OF ANY TRADING SYSTEM OR METHODOLOGY IS NOT INDICATIVE OF FUTURE RESULTS.
Risk Disclosure for Genie Results, T.03, T.03+ and TradeProgram: HYPOTHETICAL PERFORMANCE RESULTS HAVE MANY INHERENT LIMITATIONS, SOME OF WHICH ARE DESCRIBED BELOW. NO REPRESENTATION IS BEING MADE THAT ANY ACCOUNT WILL OR IS LIKELY TO ACHIEVE PROFITS OR LOSSES SIMILAR TO THOSE SHOWN; IN FACT, THERE ARE FREQUENTLY SHARP DIFFERENCES BETWEEN HYPOTHETICAL PERFORMANCE RESULTS AND THE ACTUAL RESULTS SUBSEQUENTLY ACHIEVED BY ANY PARTICULAR TRADING PROGRAM. ONE OF THE LIMITATIONS OF HYPOTHETICAL PERFORMANCE RESULTS IS THAT THEY ARE GENERALLY PREPARED WITH THE BENEFIT OF HINDSIGHT. IN ADDITION, HYPOTHETICAL TRADING DOES NOT INVOLVE FINANCIAL RISK, AND NO HYPOTHETICAL TRADING RECORD CAN COMPLETELY ACCOUNT FOR THE IMPACT OF FINANCIAL RISK OF ACTUAL TRADING. FOR EXAMPLE, THE ABILITY TO WITHSTAND LOSSES OR TO ADHERE TO A PARTICULAR TRADING PROGRAM IN SPITE OF TRADING LOSSES ARE MATERIAL POINTS WHICH CAN ALSO ADVERSELY AFFECT ACTUAL TRADING RESULTS. THERE ARE NUMEROUS OTHER FACTORS RELATED TO THE MARKETS IN GENERAL OR TO THE IMPLEMENTATION OF ANY SPECIFIC TRADING PROGRAM WHICH CANNOT BE FULLY ACCOUNTED FOR IN THE PREPARATION OF HYPOTHETICAL PERFORMANCE RESULTS AND ALL WHICH CAN ADVERSELY AFFECT TRADING RESULTS.