The bull is dead, long live the bull
“To every
thing there is a season, and a time to every purpose under the heaven”
Ecclesiastes
3:1
Welcome to 2023. 2022 was the year of continued US
imperialistic expansion towards the East, the year where everything became
expensive, the year of inverted yield curves with everybody expecting a deep
recession soon and the year of breakdown of risk parity between stocks and
bonds as they both declined. We endured sky high inflation, yet ironically, the
only asset class that really performed was the $US. Even gold was flat last
year and that when the cost of living exploded. What is going on?
Not much really ... Markets do what they do and opinions of
traders, macro experts, FED officials, bankers and many, many other
commentators are usually nothing more than an attempt to a rational explanation
of something inexplicable. Humans have this urge to come up with sophisticated
conclusions that in fact do nothing more than hide we have no clue why happened
what happened nor what is going to happen in markets. Markets do what they do
and really smart people admit that there is something superhuman about market
moves they can not understand.
Now already more than a decade ago I got fascinated with the
Danielcode exactly because it was the first piece of knowledge that taught me
there is a hidden order in markets controlled by the uncontrollable and
superhuman variable called time. A time variable present on the horizontal axis
of every chart out there yet ignored by everyone except a few lunatics who
still believe in the word of God and the Bible. That got my attention. Big time
...
I’m am not going into details here on what the Danielcode is
or how it works. There are plenty of articles written on that freely available
on the Danielcode website. I urge you to read them. If one of them inspires
you, you will read them all.
The basic idea is that markets are ruled by time cycles
calculated out of the mathematical DC matrix. The idea is preposterous, I know,
but the reality sure is not. Markets make highs and lows only when one or
multiple DC time cycles expire. Without exception. Time controls the whole
show. Show me any market and I will show you the time cycles at the highs and
lows at which that market has turned lower or higher. And it is really much
easier to learn it than it is to believe it. An example below shows you that
the major high early 2022 came on the DC 62 cycle top followed by a 59 cycle
top the DC week after. The 62 cycle is the invert cycle as I call it because it
changes the market direction in the opposite way of it’s origin (highs give us
lows and lows give us highs).
The sole reason why the SPX made that top early 2022 is
because the DC 62 time cycle expired. All the technical, macro, monetary and
many other explanations as to why it topped there first of all came after the
fact and basically are nothing more than a seemingly intellectual way to
satisfy or rational thinking minds to understand why happened what happened.
Only the crazy ones accept the divine powers of time and there dominance in the
universe. Consider me a lunatic.
Now, I can talk all I want about he past, it will and should
not impress you. At best it should get you interested. Predicting the past is a
piece of cake. Doing the same with the future is something else. What you want
to know of course is when this amazing bull market that started in March 2009
will end or has maybe already ended. The only honest answer any expert should
give you is “I don’t know”. We have no foreknowledge about the future. That is
the privilege of God only. But that does not mean there are no Danielcode
clues. In fact Danielcode charts are full of clues. You just need some skill
and lots of belief to read them.
DC time cycles predict highs or lows but say nothing about
the momentum of the turn. A top cycle could give us a small correction or a
major move lower. We do not know in advance. Still the cycle is relevant even
with small corrections because when the correction is over and the market
exceeds the previous highs it reconfirms the higher degree uptrend from a DC
time perspective. And that is very valuable trading information. A perfect
example of that is the high I foresaw in the summer of 2021. It was a major
setup coming from the low after the low in October 2016. I expected it to be
major, it turned out to be a minor top. It gave us a correction and sideways
move for a few weeks and then moved on to higher highs in the fall of 2021. The
higher highs reconfirmed the long term uptrend and we became bullish again in
the 4th seal updates.
Let’s start with what we know from experience in trading the
SPX. For major highs we need the expiration of a 59 cycle top. For major lows
we need a 62 cycle low. For intermediate highs or lows the 44 cycle is perfect.
To end a major bull market we need a 59 cycle top, coming from the first hop,
as subtle as possible and preferably originating from a corrective structure.
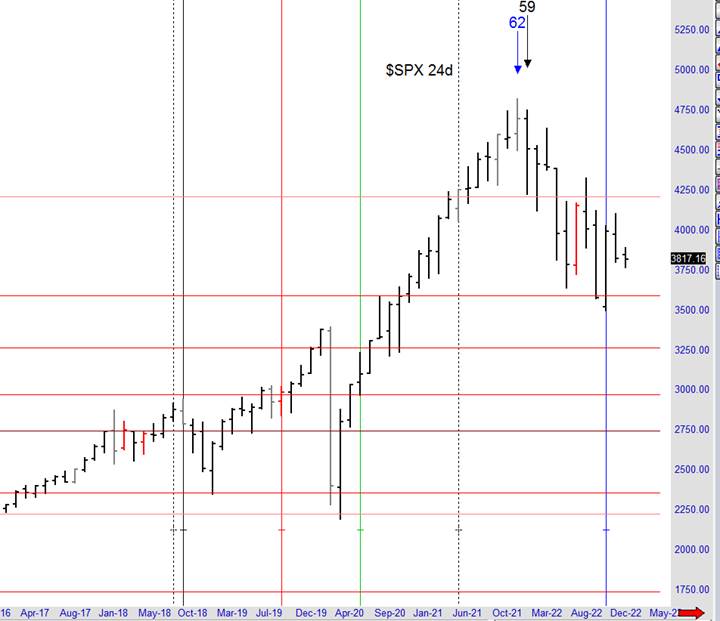
We should get this cycle on the 6 day chart but major highs preferably should
also vibrate on the 24 day chart.
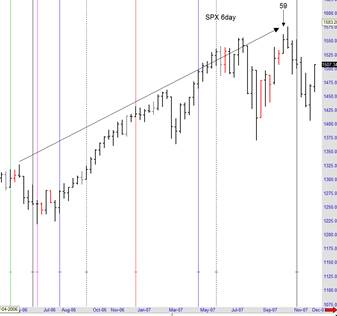
The chart on the previous page shows you the 59 cycle top
that gave us the closing high leading to the global financial crisis of
2007-2009. Starting from what we know I can do nothing else than conclude that
the bull market that started in March 2009 has not yet run it’s course. The top
early 2022 came on a 62 cycle top which is not the cycle that kills the long
term bull. I can not find any 59 cycle top on any equity chart on that top last
year so I have to remain longer term bullish. That does not mean we can not
correct deeper and longer here but overall it should remain a correction after
which the markets travels to new highs. That is a first piece of clue that is
very useful to traders. Right now pretty much every expert out there is
predicting recession and lower prices. I disagree with an opinion purely and
only based on reading what the DC cycles tell me.
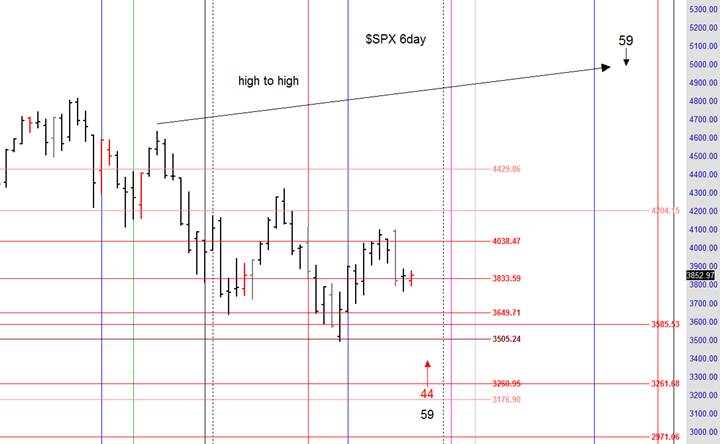
Now I can hear your question already : “If you are not
bearish here do you have an idea when this amazing bull market might end?”. Yes
I do and I will explain. We need a 59 cycle top coming from a high in the past
on the 6 day chart. The first that comes up is the 59 cycle top coming from the
high in 2022 and running from 5/22 to 5/30 this year. Before that there are no
decent highs that qualify for the job.
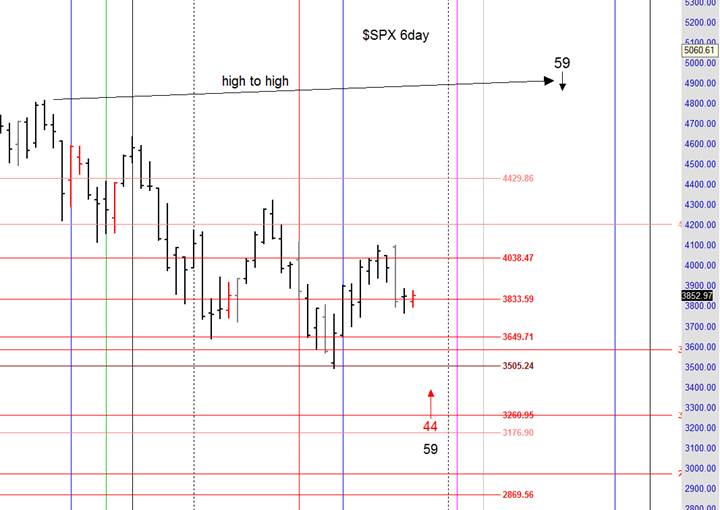
I don’t like it. The high in January 2022 where this cycle
originates from was a big high. Anyone can see it from a mile away. From my
experience important and major 59 cycle tops originate from much more subtle
highs, something the average trader would consider as an unimportant short term
high in the market. The next 59 cycle top originates from exactly that. It is
the 59 cycle top that comes from the April 2022 high and runs from 8/15 to 8/22
this year.
I like this
setup because it has all the properties a major 59 cycle top needs to end this
bull market. I like it even more as it comes from the high after the high in
2022. The reason for that comes from Ecclesiastes.
“If thou seest the oppression of the poor, and the violent
perverting of justice and righteousness in the state, marvel not at the matter;
for one higher than the high watcheth, and there are higher than they.”
Ecclesiastes 5:8
Another
potential setup to cap the bull market is a 59 cycle top from the second high
after the high. This 59 cycle comes from the August 2022 high and projects a
top at the end of the year 2023. I don’t like this setup either as it does not
confirm with a similar setup on the 24 day chart which is the case for the 59
cycle from the high after the high.
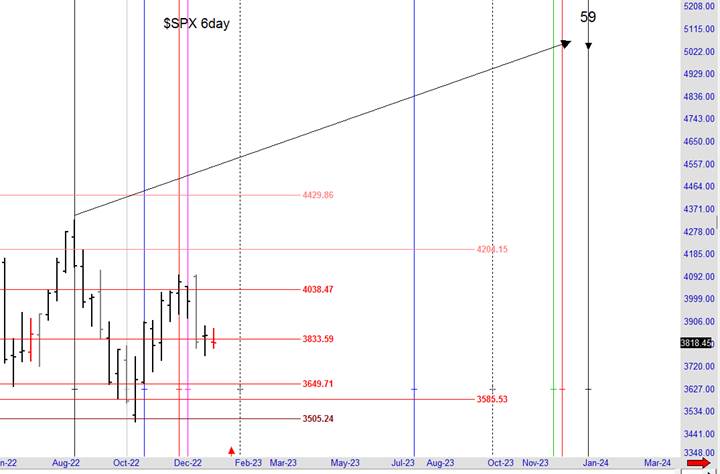
The last
potential setup to kill the bull is the 59 cycle top originating from the
December 2022 high and expires late April 2024. This corrective structure since
the December high last year is still running and not completed so we can not
make decent conclusions on this one yet. What I can say that is is perfectly
confirmed by a similar cycle on the 24 day chart but not on the 12 day chart.
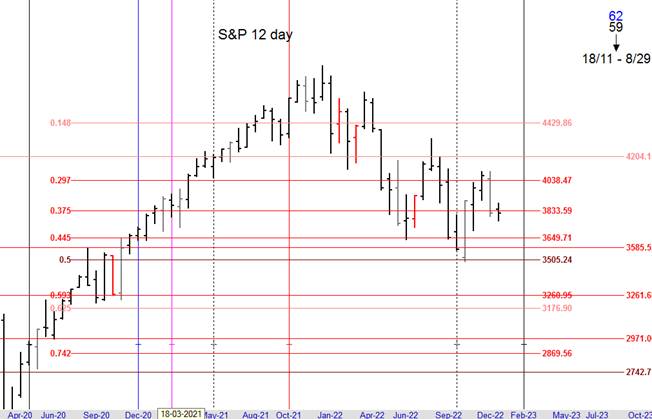
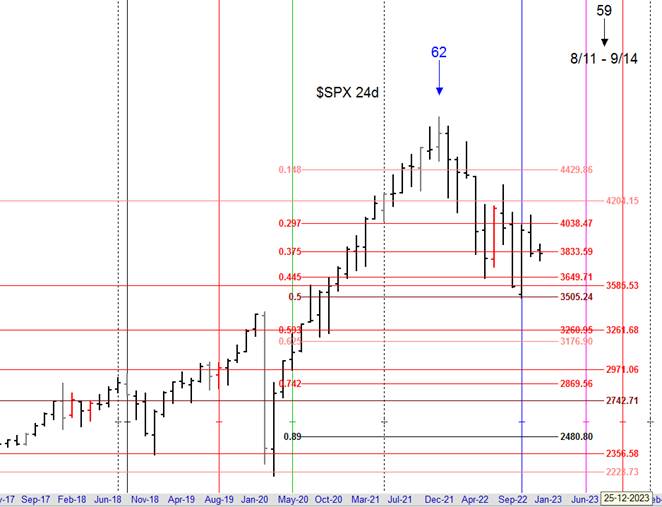
A seen today
the 59 cycle top coming from the high after the high and running early second
half of August this year is the one that get’s my attention now. The next page
shows similar cycle setups that confirm the critical time zone from the 12 day
chart and 24 day chart.
I will even throw in a bonus chart that confirms the setup. Here is a
chart where every bar is 59 trading days which is 2 times our basic time unit
of 29.666. This is a very long term chart and it has an inversion 62 cycle top
running from 7/26 until 10/17 this year. Our 6 day 59 cycle top from the high
after the high comes in the beginning of this period which is perfect.
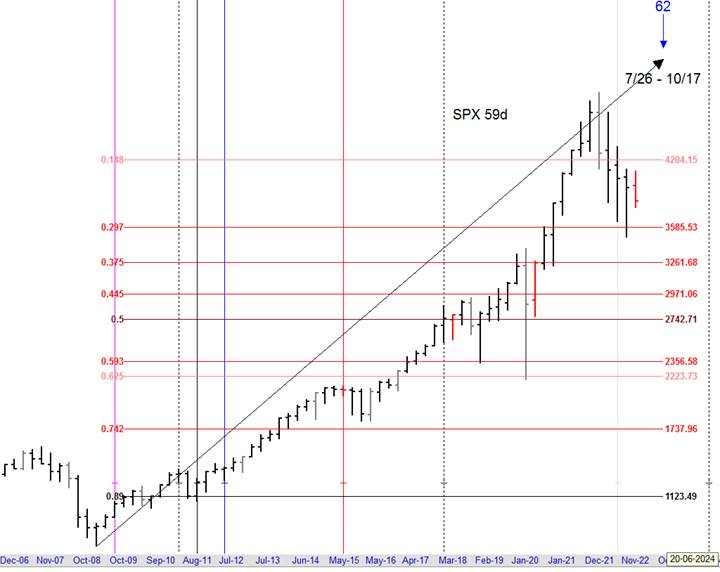
Isn't that something. A number from the square (5/8 or 62.5) that
forecasts a high on a chart based on a major number of the binomial (2 times
29.6 = 59.3). It could not vibrate in a better way.
If you put a gun to my head and make me forecast where this bull
market might end I would conclude that a few days after mid August 2023 the
bull market is done. As we get closer and closer to that date in the coming
weeks the quality and confidence of that forecast should get higher and higher.
If not it will invalidate it and forecast a low or something else. The weeks
and months ahead will tell and all of it will be updated weekly to the 4th
seal subscribers. That also means that until August 2023 we have to remain
overall bullish minded. That does not mean we ignore corrections or trade them
but this market should seek new highs before August. Weekly updates on this
story follow. Understand that with each market holiday between now and August
the dates of the cycle window move up with 1 day and when the holiday is a
Friday with 2 more extra days for the weekend. These cycles are usually very
precise.
Let me give a word of caution though as I am convinced one day this
powerful bull market will end. It will end on a Danielcode time cycle. A lot of
excesses have been build up since March 2009 and they are at risk a soon as a
DC time cycle bites. Also realize that markets top in tricky ways, fooling you
into believing they will go higher. I have no idea how the SPX will top but
this article now gives you the first next opportunity as to WHEN it
could/should happen. Keep and open mind and follow the daily DC signals on the
website when trading. They too are clues.
One more warning. It is not our job to become prophets nor do
I want to emulate what Isaac Newton described as “the folly of interpreters”.
I’m just the messenger here. I read the Danielcode numbers on financial charts.
I look at financial markets through Danielcode lenses and try to translate what
it is telling in plain English. I encourage you to study this stuff. I promise
you, you will be amazed. Markets are ruled by the Danielcode. Markets move
within the boundaries of Danielcode numbers and make turns on Danielcode time
cycles. If we want to know what is ahead we have to listen what it is telling
us. The only limitation that the Danielcode has in forecasting markets is our
ability to decipher it.
“The fear of
the Lord is the beginning of wisdom; all those who practice it have a good
understanding”
Psalm 111:10
Isaac Newton knew that there was major knowledge
hidden in the Book of Daniel. He gives us solid warnings.
Frank De Baere
Belgium
January 2023
Disclaimer: All the reports, charts and content in the Danielcode web site are for educational purposes only and do not constitute trading advice nor an invitation to buy or sell securities. The views are the personal views of the author only and should be treated as such. Before acting on any of the ideas expressed, the reader should seek professional advice from a licensed broker in the appropriate jurisdiction.
Risk Disclosure for Front Page, Long Term Trend Charts: THE RISK OF LOSS TRADING COMMODITIES OR FUTURES CAN BE SUBSTANTIAL. COMMODITY TRADING HAS LARGE POTENTIAL RISKS, IN ADDITION TO ANY POTENTIAL REWARDS. YOU MUST BE AWARE OF THE RISKS AND BE WILLING TO ACCEPT THEM IN ORDER TO INVEST IN THE FUTURES OR COMMODITIES MARKETS. DON'T TRADE WITH MONEY YOU CAN'T AFFORD TO LOSE. THIS IS NEITHER A SOLICITATION NOR AN OFFER TO BUY OR SELL COMMODITY INTERESTS. THE USE OR PLACEMENT OF ANY STOP-LOSS OR STOP-LIMIT ORDERS MAY NOT LIMIT YOUR LOSSES AND YOU COULD LOSE MORE THAN YOUR INTENDED AMOUNT OF MONEY AT RISK. PAST PERFORMANCE OF ANY TRADING SYSTEM OR METHODOLOGY IS NOT INDICATIVE OF FUTURE RESULTS.
Risk Disclosure for Genie Results, T.03, T.03+ and TradeProgram: HYPOTHETICAL PERFORMANCE RESULTS HAVE MANY INHERENT LIMITATIONS, SOME OF WHICH ARE DESCRIBED BELOW. NO REPRESENTATION IS BEING MADE THAT ANY ACCOUNT WILL OR IS LIKELY TO ACHIEVE PROFITS OR LOSSES SIMILAR TO THOSE SHOWN; IN FACT, THERE ARE FREQUENTLY SHARP DIFFERENCES BETWEEN HYPOTHETICAL PERFORMANCE RESULTS AND THE ACTUAL RESULTS SUBSEQUENTLY ACHIEVED BY ANY PARTICULAR TRADING PROGRAM. ONE OF THE LIMITATIONS OF HYPOTHETICAL PERFORMANCE RESULTS IS THAT THEY ARE GENERALLY PREPARED WITH THE BENEFIT OF HINDSIGHT. IN ADDITION, HYPOTHETICAL TRADING DOES NOT INVOLVE FINANCIAL RISK, AND NO HYPOTHETICAL TRADING RECORD CAN COMPLETELY ACCOUNT FOR THE IMPACT OF FINANCIAL RISK OF ACTUAL TRADING. FOR EXAMPLE, THE ABILITY TO WITHSTAND LOSSES OR TO ADHERE TO A PARTICULAR TRADING PROGRAM IN SPITE OF TRADING LOSSES ARE MATERIAL POINTS WHICH CAN ALSO ADVERSELY AFFECT ACTUAL TRADING RESULTS. THERE ARE NUMEROUS OTHER FACTORS RELATED TO THE MARKETS IN GENERAL OR TO THE IMPLEMENTATION OF ANY SPECIFIC TRADING PROGRAM WHICH CANNOT BE FULLY ACCOUNTED FOR IN THE PREPARATION OF HYPOTHETICAL PERFORMANCE RESULTS AND ALL WHICH CAN ADVERSELY AFFECT TRADING RESULTS.