That mishmash of corporate gluttony, arrogance and yes, sheer animal spirits known as the US Stock Market has been baking since March 2009 to produce an amazing bull market out of the depths of despair, hate and loathing brought on by the subprime crash from 2007. As bull markets go, this has been a doozy topped with a frothy blow off ignited by enthusiasm and regretfully unfounded belief in the restorative powers of the new President. I like where the S&P is positioned as a convincing top and whilst we await the final crescendo from the ubiquitous fat lady, there is now a plethora of soft and hard data which should at least cause us to examine the prevailing landscape for clues of the prevailing clime. The answer to the endless calls of "Are we there yet Mummy" so essential to any long journey with les enfants requires more than an exasperated "Yes damn it". It requires an exposition of what is (why is this great place that we have travelled so far to see really so great after all) and what is to be; we have travelled far and are now here. What now?
If you are one of those in the "enjoy the journey" camp it has been a truly incredible journey. From the 2009 low the S&P Index has travelled up a perfectly delineated channel without a single instance of a close outside the 1X1SD support of the Danielcode trading channel on our long term chart:
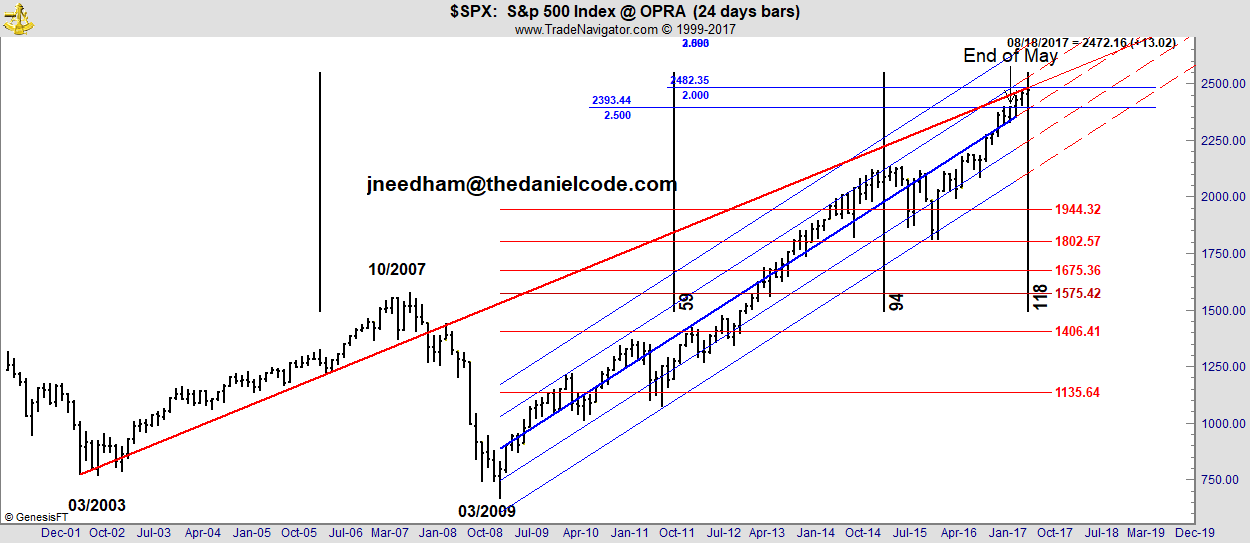
This chart is quite busy as it combines a number of pieces of vital data but take it step by step and you will see the argument. The diagonal blue channel lines are our proprietary DC trading channel. The setting of this is fixed by price action and the major DC ratio. It is not discretionary and has been seen by clients regularly at our public webinars. The horizontal blue lines are long term price targets, the vertical black lines are Time cycle expirations and the diagonal red line is what we call a 4th Seal line. This is an angle and like all angles has properties of both Time and Price. This particular line is both a 4th and 5th Seal line. Our mantra is that "When Time and Price are squared a market turn is almost inevitable" and 4th and 5th Seal lines identify the points at which this confluence and indeed sometimes conflagration occur! By this we mean that Price is at an identifiable DC target level and Time is also at an identifiable DC Time cycle. This for all my troubled Gann friends is not Gann. This not a 1X1 or 3X1 line from the late and unlamented WDG. 4th and 5th Seal lines are created solely by market price action. They are of the market and not imposed on the market. Let's break that down to its essential parts. From Forum 07/28:
At our 06/22 webinar (at 59:25) I told you that the next target for the S&P Index $SPX was 2482. We reached that number (2481.24) in the previous 6 day period and this week we have reached 2484, so we are well and truly on target. You may recall our previous call for a target at 2400 which was reached on the 6 day period ending on 03/08 and which held this market until 05/24. Big reaction on Thursday in the S&P Futures which made a nice key reversal bar against the DC daily Futures Blue line at 2480 with today's high in the EMini Futures being 2480.50 for just a two tick variance against target.
 On this 24 day chart (the target numbers vary slightly as time frames change) we see the 2393 target which we called as 2400 and we estimated that number to be reached in May 2017, as it was. The next number was 2482 and the present high is 2484 which is close enough for government business. Keep in mind that Futures charts are generally more accurate than Index charts but we are splitting hairs here. The second of our major targets has been reached.
Simultaneously on this chart at least we are sitting on an expiring 59 Time cycle. This one is a major DC Time cycles and is usually associated with a top. The shown cycle and its associate which runs from 07/2002 are extensions of the DC Time cycles and are not the first hop, ergo this is not the crash cycle which we saw at the 2000 and 2007 highs. And that my friends is the hard data for at least a nearby inflection point and perhaps much more. Bear in mind that a simple 50% correction of the major swing is almost 1000 points down. Now that would be fun!!
To this you can add copious dobs of soft data based on the Russell not confirming Dow's meteoric recent move and the overweighting of FANGS+M and generally the outperformance of the shooting starts (not SNAP) whilst the broader market is much more subdued.
The degree to which the casino's speculative mania has been concentrated in the FAANGs + M can also be seen by contrasting them with the other 494 stocks in the S&P 500. The market cap of the index as a whole rose from $17.7 trillion in January 2015 to some $21.2 trillion at present, meaning that the FAANGs + M account for about 40% of the entire gain. Stockman at ZH
None of this equates to Woe is me or The end is Nigh, Nothing in trade signals speaks to quantum. But best have that seat belt cinched in.
John Needham is a Sydney Lawyer and Financial Consultant. He publishes The Danielcode Online and writes occasionally on other markets. He lives with his family in Australia and New Zealand. Please visit us at www.thedanielcode.com where there is much to learn.
"The fox knows many things, but the hedgehog knows one big thing. A Hedgehog Concept is not a goal, intention or strategy to be the best. It is an understanding of what you can be best at. The distinction is absolutely crucial". ~ Isaiah Berlin, The Hedgehog and the Fox
Disclaimer: All the reports, charts and content in the Danielcode web site are for educational purposes only and do not constitute trading advice nor an invitation to buy or sell securities. The views are the personal views of the author only and should be treated as such. Before acting on any of the ideas expressed, the reader should seek professional advice from a licensed broker in the appropriate jurisdiction.
Risk Disclosure for Front Page, Long Term Trend Charts: THE RISK OF LOSS TRADING COMMODITIES OR FUTURES CAN BE SUBSTANTIAL. COMMODITY TRADING HAS LARGE POTENTIAL RISKS, IN ADDITION TO ANY POTENTIAL REWARDS. YOU MUST BE AWARE OF THE RISKS AND BE WILLING TO ACCEPT THEM IN ORDER TO INVEST IN THE FUTURES OR COMMODITIES MARKETS. DON'T TRADE WITH MONEY YOU CAN'T AFFORD TO LOSE. THIS IS NEITHER A SOLICITATION NOR AN OFFER TO BUY OR SELL COMMODITY INTERESTS. THE USE OR PLACEMENT OF ANY STOP-LOSS OR STOP-LIMIT ORDERS MAY NOT LIMIT YOUR LOSSES AND YOU COULD LOSE MORE THAN YOUR INTENDED AMOUNT OF MONEY AT RISK. PAST PERFORMANCE OF ANY TRADING SYSTEM OR METHODOLOGY IS NOT INDICATIVE OF FUTURE RESULTS.
Risk Disclosure for Genie Results, T.03, T.03+ and TradeProgram: HYPOTHETICAL PERFORMANCE RESULTS HAVE MANY INHERENT LIMITATIONS, SOME OF WHICH ARE DESCRIBED BELOW. NO REPRESENTATION IS BEING MADE THAT ANY ACCOUNT WILL OR IS LIKELY TO ACHIEVE PROFITS OR LOSSES SIMILAR TO THOSE SHOWN; IN FACT, THERE ARE FREQUENTLY SHARP DIFFERENCES BETWEEN HYPOTHETICAL PERFORMANCE RESULTS AND THE ACTUAL RESULTS SUBSEQUENTLY ACHIEVED BY ANY PARTICULAR TRADING PROGRAM. ONE OF THE LIMITATIONS OF HYPOTHETICAL PERFORMANCE RESULTS IS THAT THEY ARE GENERALLY PREPARED WITH THE BENEFIT OF HINDSIGHT. IN ADDITION, HYPOTHETICAL TRADING DOES NOT INVOLVE FINANCIAL RISK, AND NO HYPOTHETICAL TRADING RECORD CAN COMPLETELY ACCOUNT FOR THE IMPACT OF FINANCIAL RISK OF ACTUAL TRADING. FOR EXAMPLE, THE ABILITY TO WITHSTAND LOSSES OR TO ADHERE TO A PARTICULAR TRADING PROGRAM IN SPITE OF TRADING LOSSES ARE MATERIAL POINTS WHICH CAN ALSO ADVERSELY AFFECT ACTUAL TRADING RESULTS. THERE ARE NUMEROUS OTHER FACTORS RELATED TO THE MARKETS IN GENERAL OR TO THE IMPLEMENTATION OF ANY SPECIFIC TRADING PROGRAM WHICH CANNOT BE FULLY ACCOUNTED FOR IN THE PREPARATION OF HYPOTHETICAL PERFORMANCE RESULTS AND ALL WHICH CAN ADVERSELY AFFECT TRADING RESULTS.