The Greatest Story Never Told
Random Walk Theory, one of the most widely known and
accepted tenets of financial knowledge, postulates that changes in asset prices
are random. The outcome is that stock prices move unpredictably so that past
prices cannot be used to predict future prices accurately. This theory
challenges the idea that traders can time the market or use technical analysis
to identify and profit from patterns or trends in stock prices. However, the
slavish adherence to price and the myriad of studies Random Walk Theory
supports as the basis of market analysis have done traders a great disservice.
From learn-to-trade through portfolio creation and management, superannuation,
savings, and wealth accounts, this is a multi-billion-dollar industry. An
understanding of when and where markets move is the foundation of trading
knowledge. If one seeks a better understanding of why markets do what they do,
there is another way, and I want to introduce you to something completely
different – The Other Way – Danielcode Time.
Every bar on every chart has elements of both Time and
Price, yet strangely, no weight is given to the effects of Time on charts of
various periods. Random Walk has suppressed that, but as every trial lawyer
knows, an answer is largely a function of the question asked. If we add the
element of Time, a different pattern emerges. By Time, I mean the normal
periodic cycles that impact our daily lives.
At the
Danielcode (DC), we start with a unique group of Time ratios from a historical
document, a statement of just fifteen lines that gives us the rule of eighths
and a sequence of Time cycles. Before April 9, 2001, when the
Securities and Exchange Commission ordered all U.S. stock markets to switch to
the decimal system, prices were reported, and stocks were denominated, in
fractions – in one-sixteenths to be
exact. One-sixteenth is half of one-eighth and was
the basis of all stock market quotes before decimalization. This
approach is still in use in the old Board of Trade markets, such as grains,
which uses two-eighths or one-quarter, and US T-Bonds, which uses a tick value
of thirty-two or four-eighths. Applying basic math to the numbers in this historic
text creates a base number for Time of 29.66 days and a known progression from
there. As all historic sources must be questioned, this particular group of
numbers not only gives us 29.66 days as Time, a number almost identical to the
length of a synodic (average) month at 29.53 days with a variance of just three
hours per month, but also a value of 365.37 days which is the length of a
calendar year accurate to about two hours a year. The ability to compare our
calculated Time cycles to known cycles gives us confidence in the veracity of
these calculations. To stress the testing, we will use index and futures
charts on our journey of discovery.
As fully 30% of daily bars do not appear on any
trading charts due to weekends and market holidays, one assumes that we should
encounter a standard error of that percentage in our calculations. However, as
I will show you, such is not the case; due to this vagary, Time and Price bars
are subject to some small dilution of accuracy. As such, we can safely discard
the numbers after the decimal point in our discussions of Time. This means that
if you do not like the historical document argument, you can adopt the length
of a synodic month as your base of Time, which is perfectly acceptable, as they
are effectively the same thing.
Danielcode Time cycles are like nothing seen before.
They are a novel concept, based on a mathematical derivative of Daniel’s Code,
a historical dissertation on Time and how it progresses as “Time, Times and a
half,” or put more simply: Time repeats, doubles, and halves. The basic number
for Time in the Danielcode lexicon is 29.66 days and it expands by halves, so
that the following number in the sequence is 44.46, then 59.32, and so on.
29.63 days is a close fit, with 29.5 the length of a synodic (average) month.
Monday,
October 19, 1987, was by far the worst day in Wall Street history
when the market fell 22.6 percent – almost twice as bad as the worst day of
1929. Black Monday passed into history, but it is not forgotten as markets have
a long and extraordinary memory. In fact, Black Monday starts a number of Time
cycles that are enduring today. At the Danielcode, we maintain that 6.21 days
is the fundamental vibration of all markets, and accordingly, we use
6-day,12-day, and 24-day charts for our Time analysis and daily charts. For our
exposé on the magic of Time, we use the S&P 500 in both its index and
futures form, which are the broadest and most widely accepted measure of the ups and
downs of equities.
The use of Time cycles clarifies our concept of how
markets work when looking at long term charts. This can be further drilled down
to daily bars, which independently create their own buy and sell signals. Add
an understanding of Time as Price (no, that is not a typo) and the path to
understanding why markets do what they do, and how they work hard to make your
trading profitable, will come into view. Now, I know from much experience that
the vast majority of you want only to see the give me the money moment,
and that is coming, but the journey must, of necessity, take you to the
questions: Does any of this work? And how much of Time cycles is astrology,
fairy tales and the much-vaunted Mars Retrograde or other esoterica? The answer
is none of it; at least, not here at the Danielcode. Here, we are
long-term sceptics, and as an Attorney of many years standing, I maintain that
every statement or proposition must be supported by better than the civic
standard of “on the balance of probabilities”, and instead be approaching the
normal criminal proof of “beyond reasonable doubt.” That is a high bar but let
me show you the road to market knowledge and a significantly boosted profit
line.
The 24-Day Long-Term Charts
Beginning on Black Monday, October 19, 1987, we start
with our long-term chart, which has 24 days to every bar. This allows us to
examine more data, and the impact of expiring Time cycles is pronounced on
these charts. From the swing high of 1987, the market ran two cycles of 44 into
the Dot.Com high of 2000 and two cycles of 70 into the closing high immediately
before the 2007 swing high on the Index. As both 44 and 70 form part of the
matrix, which we derived with some basic math from Daniel’s Code, this
immediately piqued my interest.
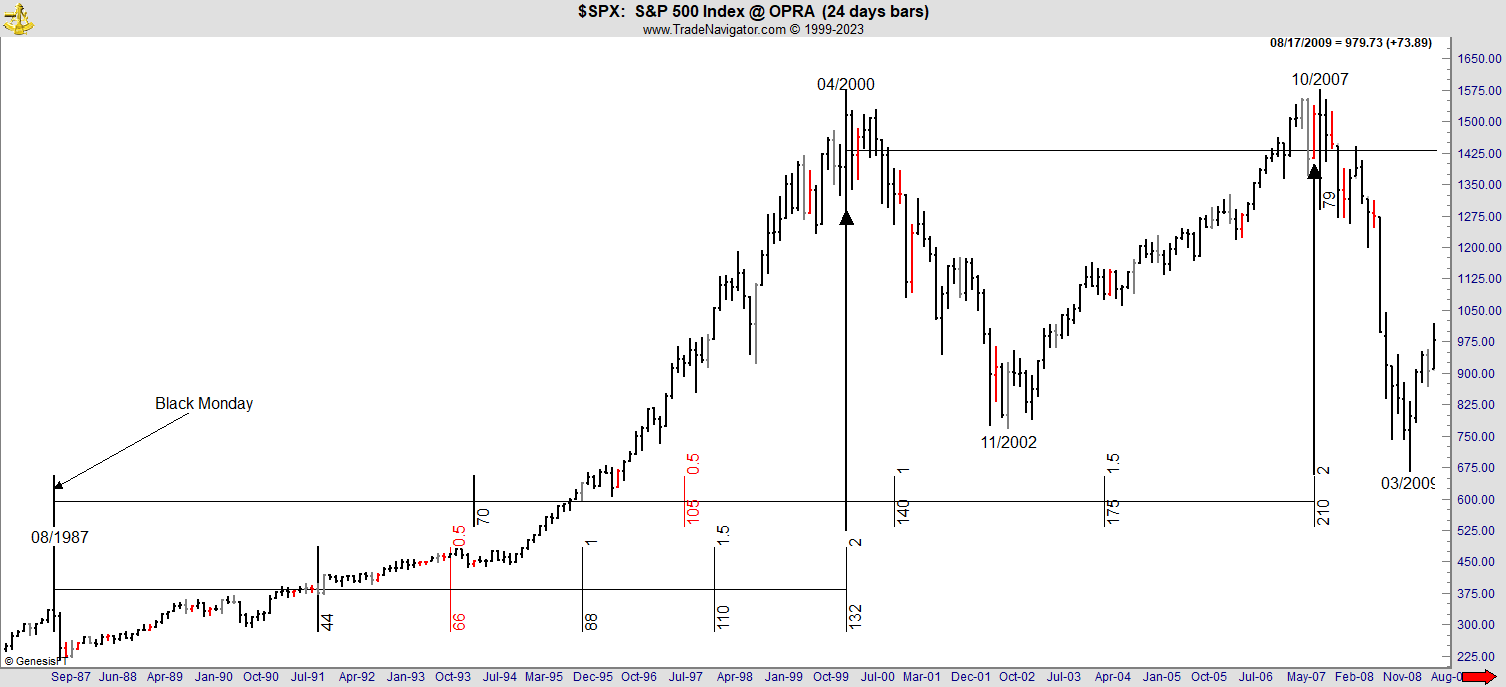
This is the S&P 500
Index on a 24-day chart.
What I am about to show you is not new; I have been talking and writing
about the marvels and mysteries of Daniel’s Code since about 2000.
In 2008 I noticed that on its 6-day chart (see
overleaf), the S&P ran a 59 period Time cycle into its 2007 top. So, we
watched to see it repeat into its 2009 low. As stated, nothing here is new or
gained with hindsight. I wrote an article about the 2009 low, which West Coast
wealth manager Financial Sense published on May 15, 2009, called 666 The
Number of The Beast. This article is available under the Articles tab on
the Danielcode (DC) website and shows you the origin of the 59 Time cycle, how
it timed the 2009 low to the day, and just a few ticks in Price.
The following chart is the 6 day chart of the S&P
500 index where every bar is created from 6 trading days. The Time cycles
reveal themselves on both the Futures chart and the Index, with views being
more visible on one or the other. For our purposes, both are valid, and we
switch between them to promote clarity.
Watch this 6-day chart of the Index closely. The
legendary WD Gann used to say, “If you are worthy, I will tell you the number,”
and to those he deemed worthy, he would tell them that the vibration of all
markets was 7, which is wrong. The minor vibration of all markets is 6.21. Note
in particular the symmetry of closing high to closing low and chart high to
chart low as the 59 Danielcode Time cycle repeats, and repeating is the highest
probability for all time cycles.
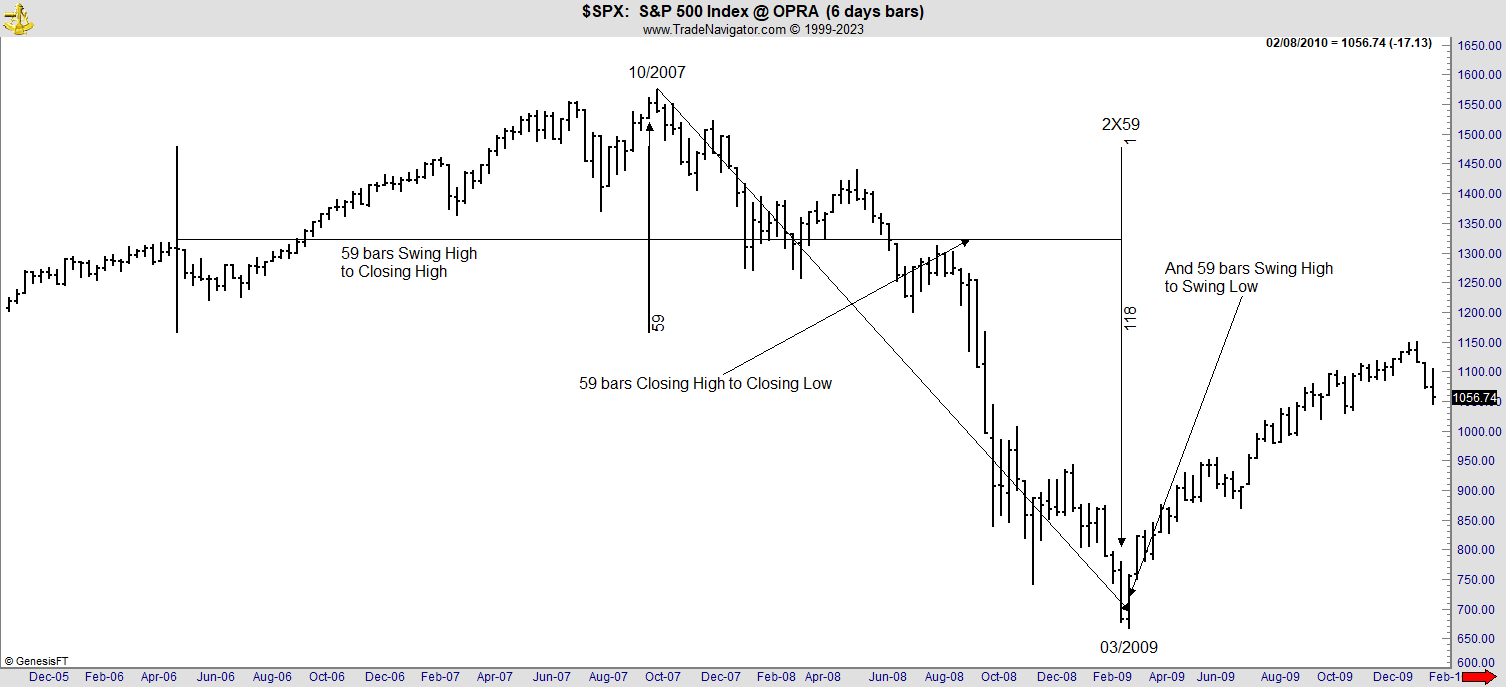
This
is the S&P 500 Index on a 6-day chart.
From here, you see the dominance of the 59 cycle
through 2006-2009. Nothing about time cycles is crude or obvious. It is always
subtle and resembles a whodunnit as clues link together. While the old
saying “…markets do not repeat, but they rhyme…” came from a wise man,
he was not a Futures or Forex player where repetition is sometimes a large part
of the game. However, the demand for nuance sometimes shows itself as a shift
in the structure of the time charts.
From the 2009 low, the dominant 59 cycle prevails, but
it shifts back to another of our Danielcode Time cycle charts, the very
long-term 24 (4×6) day chart,
where every bar comprises 24 trading days. Regarding trading days, bear in mind
that we lose 104 days to weekends and more to public holidays, so generally,
there are 252 trading days in a year. Still, we are taking 365 days or 360
degrees of Time and squeezing it into the available trading days, which are
just 69% of calendar time. The amazing thing is that these time cycles work at
all, and that they do so with such precision is another of the great wonders of
Futures and Forex. I should say here this is not market timing, as stock
traders understand it. This is something else entirely.
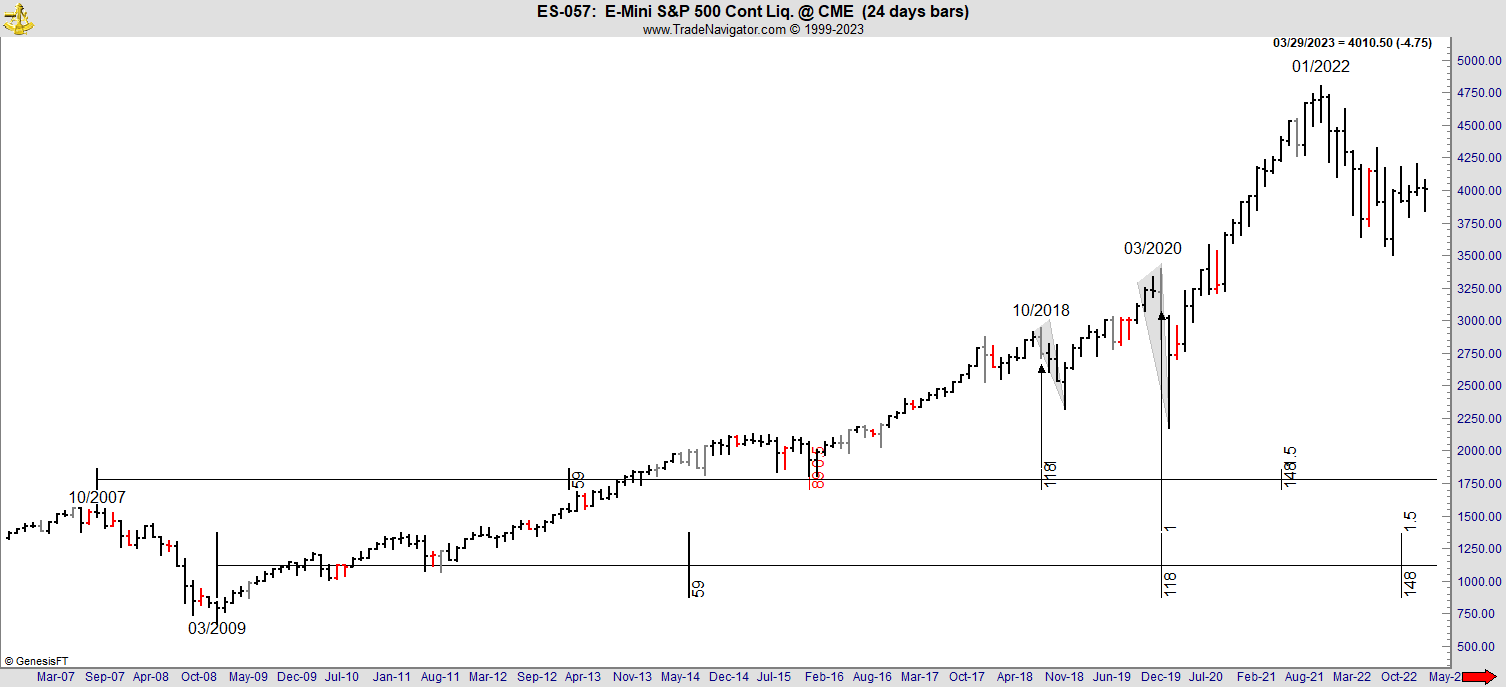
This is the
S&P 500 Emini Futures contract on a 24-day chart.
 From the chart above, we see
the quite unexpected and entirely unique recognition of the highs of the
October 2018 and the COVID flash crash high of March 2020. Of interest is how
the dual fifty-nine cycles from the 2007 high and the 2009 low both pointed to
significant breaks in the long bull market up to January 2022. The corrections
that followed from October 18 and March 20 are the
largest corrections since the 2009 low and prior to the current pullback. The
03/20 correction was the famous COVID-19 flash crash which triggered the
shortest bear market in history. Surely you cannot think the identification of
these two highly significant turns was happenstance?
From the chart above, we see
the quite unexpected and entirely unique recognition of the highs of the
October 2018 and the COVID flash crash high of March 2020. Of interest is how
the dual fifty-nine cycles from the 2007 high and the 2009 low both pointed to
significant breaks in the long bull market up to January 2022. The corrections
that followed from October 18 and March 20 are the
largest corrections since the 2009 low and prior to the current pullback. The
03/20 correction was the famous COVID-19 flash crash which triggered the
shortest bear market in history. Surely you cannot think the identification of
these two highly significant turns was happenstance?
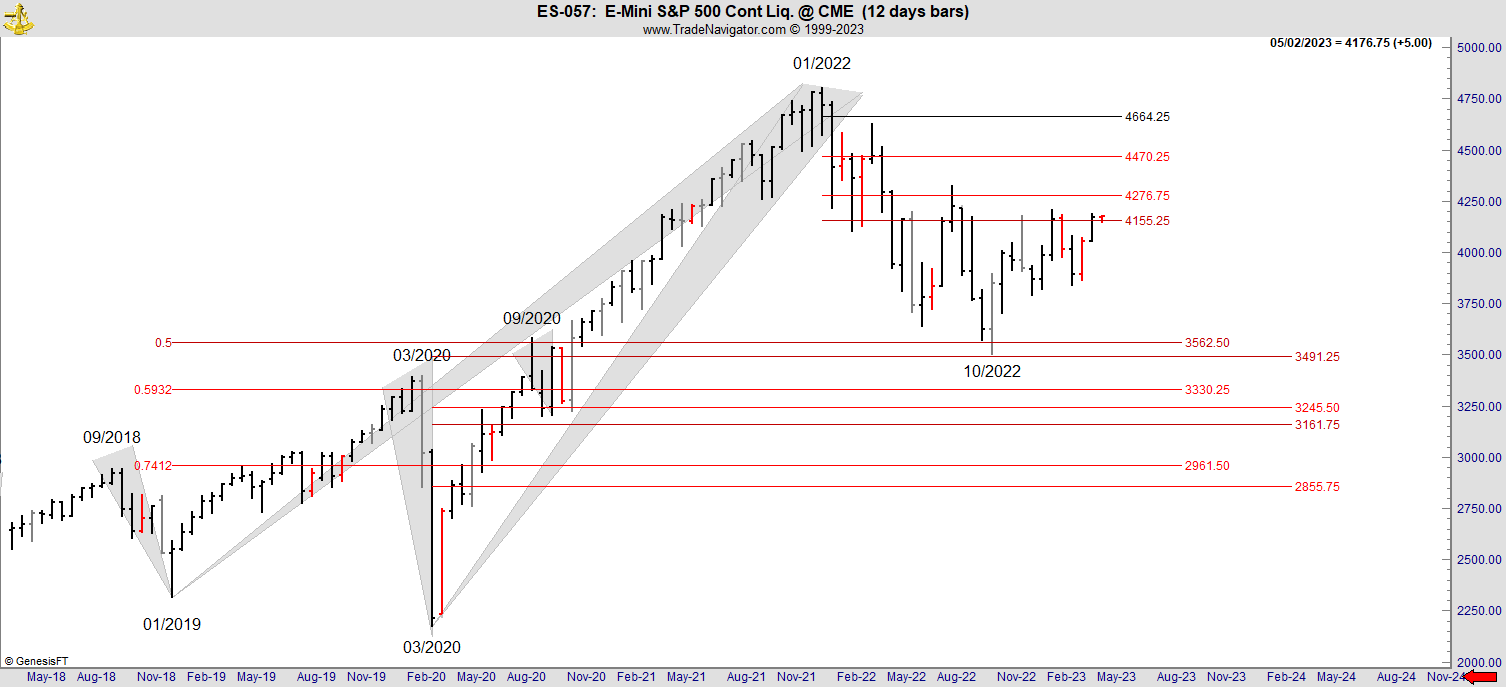
Let us look at those two dates more closely and step
down the time frame to our 12-day chart. Every bar on these charts comprises
twelve trading days, twice our basic market vibration of 6.21. Having
calculated your time cycles from the DC matrix, you can ignore the decimal
points as the missing bars discussed previously mitigate against extension of
time cycles to decimal points or partial days. The improbability of these major
cycles occurring from the 2007-2009 structure marks these corrections as major
players in the cycles to come.
Next, note the major cycles high-to-high and
low-to-low that the 2000 to 2009 charts created. Remember that apart from our
known DC cycles, we are relying on the market itself to show us which cycles
are dominating.
Back to our 24-day chart, we distinguish between swing
highs and momentum highs (closing high) and the same for the lows. On the chart
below, we measure swing high to swing high and momentum low to swing low. The
high-to-high leg measures 80 cycles on the futures chart. On its own this is
not insightful, but if we follow the same process on the Index, we see the
discrepancy as swing high to swing high on the Index is one bar less at 79.
For all of these cycles, both the Futures chart and
the Index are valid data sources. So what do we do when we see a divergence
between the two? Ignore it and go with our preferred option? Hardly. Differences
or divergences between the two data sources are highly revealing and tell us
something. Below is the index chart with its count discrepancy. One bar?
That is not even a rounding error but look what this difference produces:
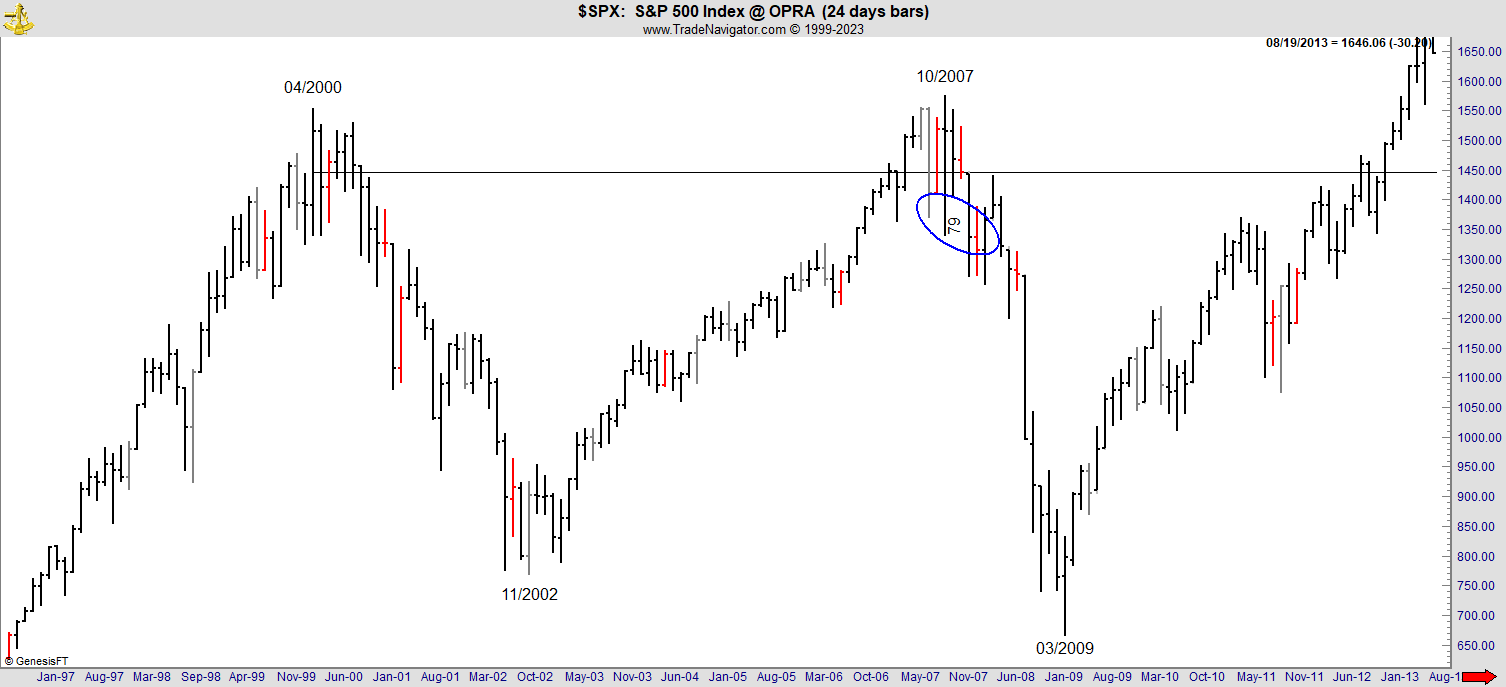
S&P 500 Index
on a 24-day chart.
To emphasise how important the 2007 high is to time
cycles, the following chart shows how the 79 and 59 cycles, both from the 2007
swing high, give us just one bar before the January 2022 all-time high and the
swing low of the current pullback.
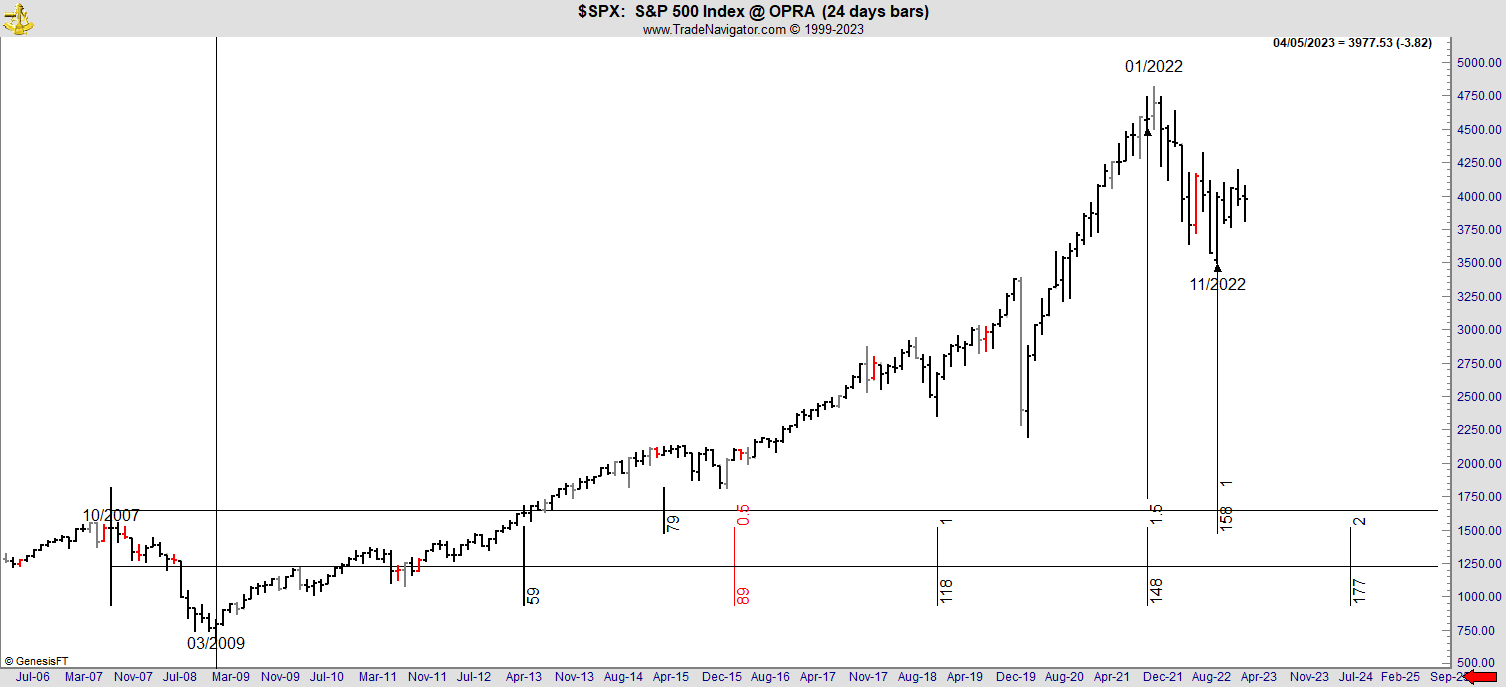
S&P 500 Index
on a 24-day chart.
Random? Not at all. Here is another view:
S&P 500 Index
on a 24-day chart.
So, there are the current highs and lows on our long-term chart. Nice
enough.
These important swing points can be achieved in
several ways, but I refrain from adding charts as you already have quite enough
to think about. However, here is a simple variance:
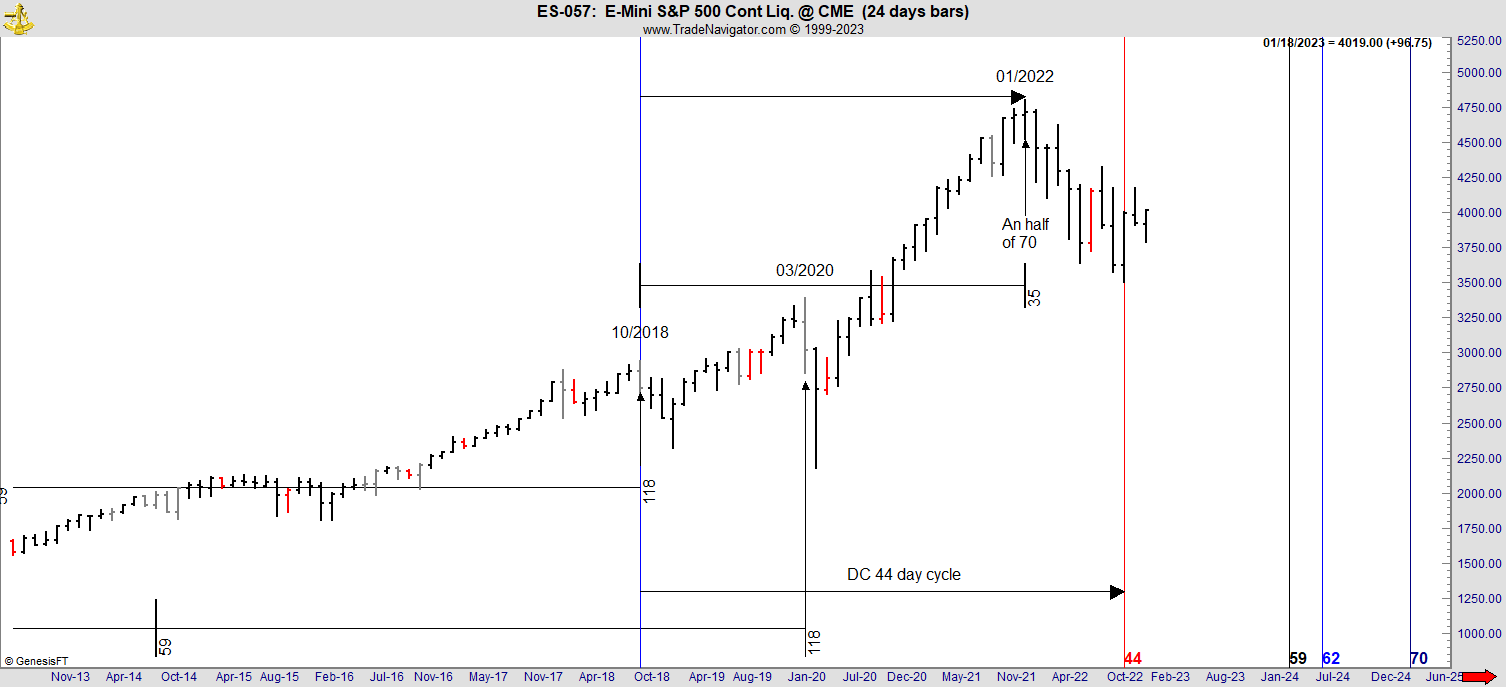
S&P 500 Emini
Futures contract on a 24-day chart.
The 35 period cycle into the 2022 all-time high is, of
course, a half of 70, the first cycle we examined. Time cycles come from the
Danielcode and from the market itself.
The 12-Day Charts
Let us switch now to our 12-day chart where every bar
is comprised of twelve trading days. We saw how potent the 79 cycle from the
missing bar on the Index was on our really long-term charts, so let’s start
with that on the twelve. We will add the 70 cycle from Danielcode, so here we
demonstrate time cycles from our host Daniel’s Code and from the market
expressing itself by showing us a simple one bar variance on the cycle count
between the S&P 500 Futures chart and the Index.
Now one bar is not even a rounding error on our
long-term charts, so why not ignore it? That is the subtlety of these Time
signals. Markets are talking to us. They have always been trying to talk to us,
but before the Danielcode, we simply did not have the language to understand them.
Now we do. Markets are working hard to enhance your prosperity if only you
could understand.
Look at the chart below; simple, clean, and
sensational. Note how the 2009 closing low gave us the 2022 closing high, while
the 70 cycle from the 09/2018 high gave us the all-time swing high. Time rules.
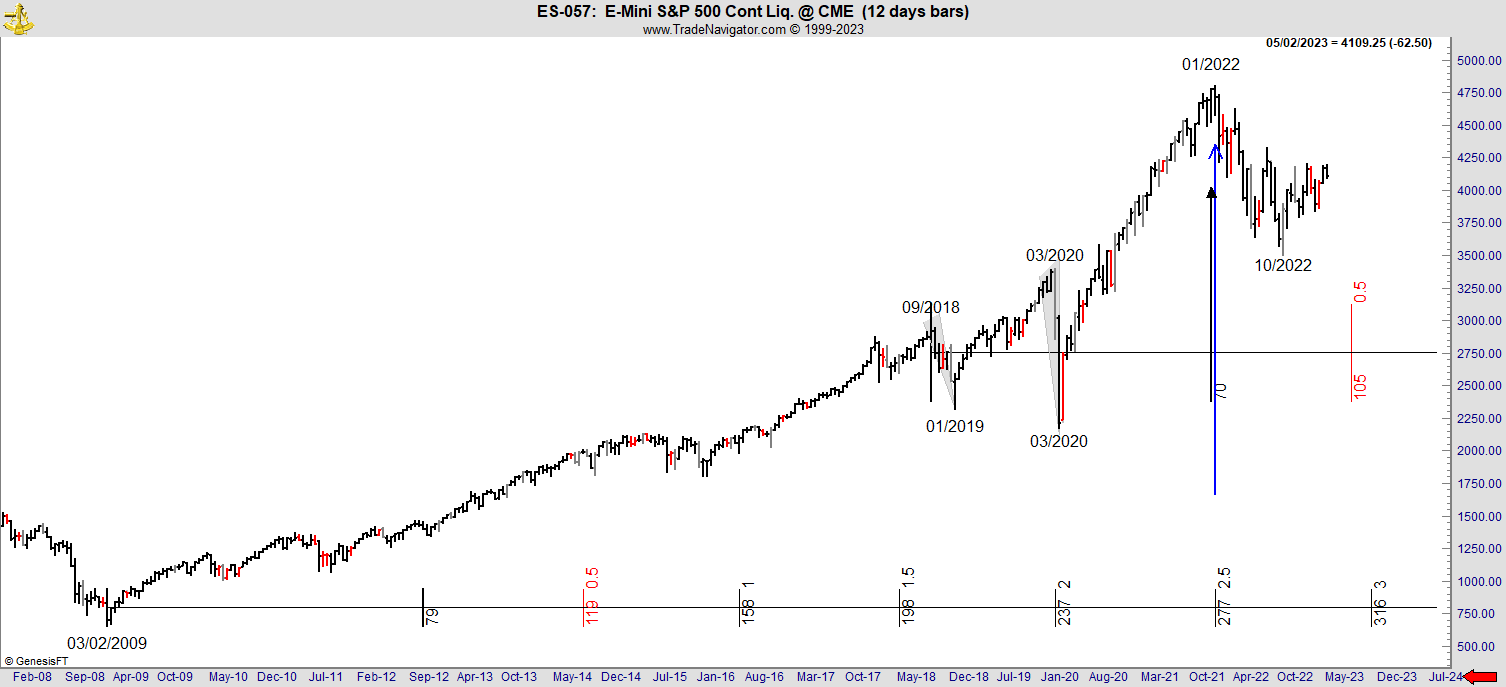
S&P 500
Futures on a 12-day chart.
The 70 cycle, which we have seen has been active since
at least Black Monday in October 1987 and is, as previously stated, still
active immediately shows us the 2022 all-time high. We can now add some
Danielcode ratios. The first two Danielcode numbers at 29 and 44 combine to
give us two completed cycles at the October 2022 low. Note how these cycles
have picked up the December 2018 and COVID-19 flash crash, closing highs to
anchor their start points.
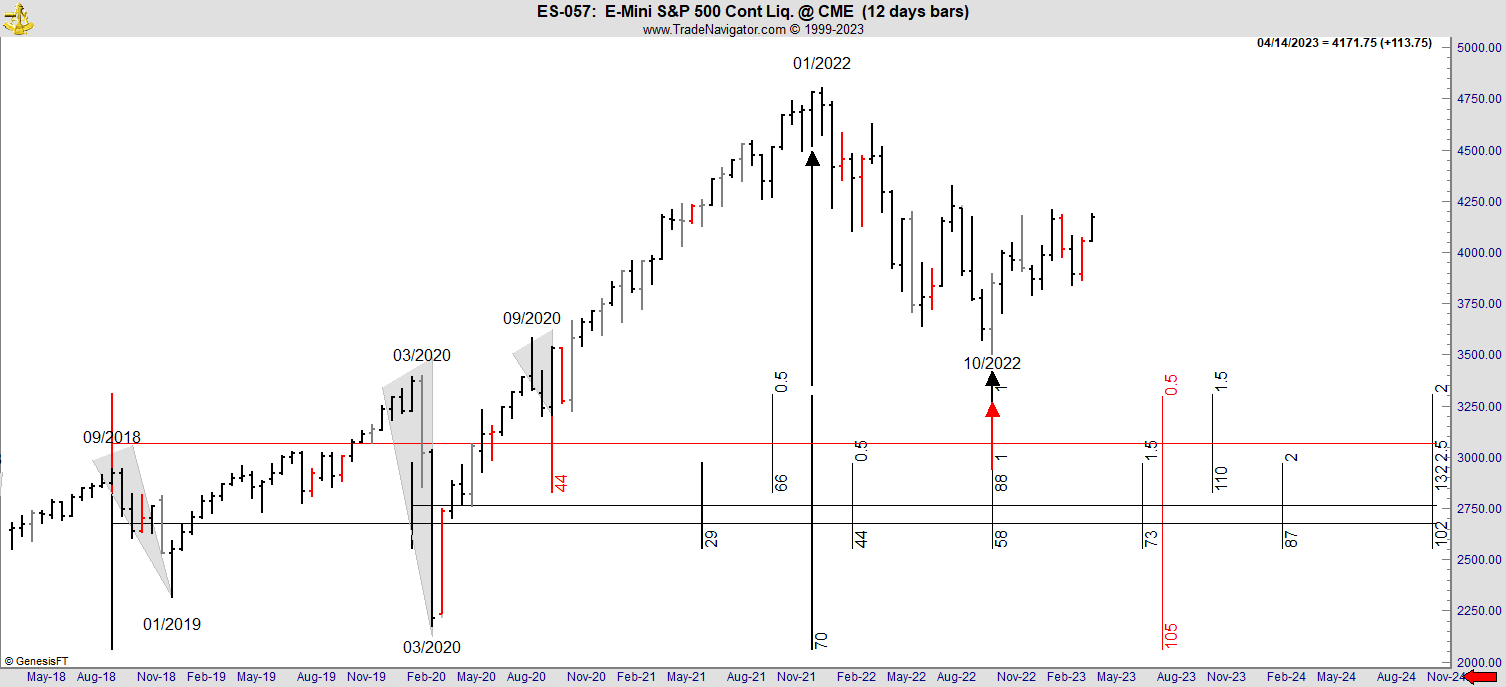
S&P 500 Emini
Futures on a 12-day chart.
The important 59 cycle found the 09/2018 and the COVID
flash crash highs at 03/2022, respectively, on our long-term 24-day charts.
These were the two biggest pullbacks between 2009 and the all-time high in
January 2022. In addition, they were found exactly at their respective
highs to the bar. The statistical probability of that being accomplished blurs
the eyes. These two market corrections will anchor our time cycles for the
foreseeable future.
Think about this for a moment; COVID was running
rampant well before 03/2020 with no effect on markets. Then suddenly, it
mattered with the COVID flash crash creating the shortest Bear Market in
history, and 23 trading days later, it did not matter at all as this market
went on to make new highs. So why was the market waiting for the vital 59 cycle
to expire? That is something to ponder as Daniel’s Code rules the twelve-day
chart equally.
S&P 500 Emini
Futures on a 12 day chart
The 6-Day Charts
This is the base of our timing charts, allowing us to see the major inflections in
the market while narrowing the time period for expected trend changes. The
feature that cycle expiration delivers on these longer-term charts is
definitive trend changes, which is the basis of all market analysis.
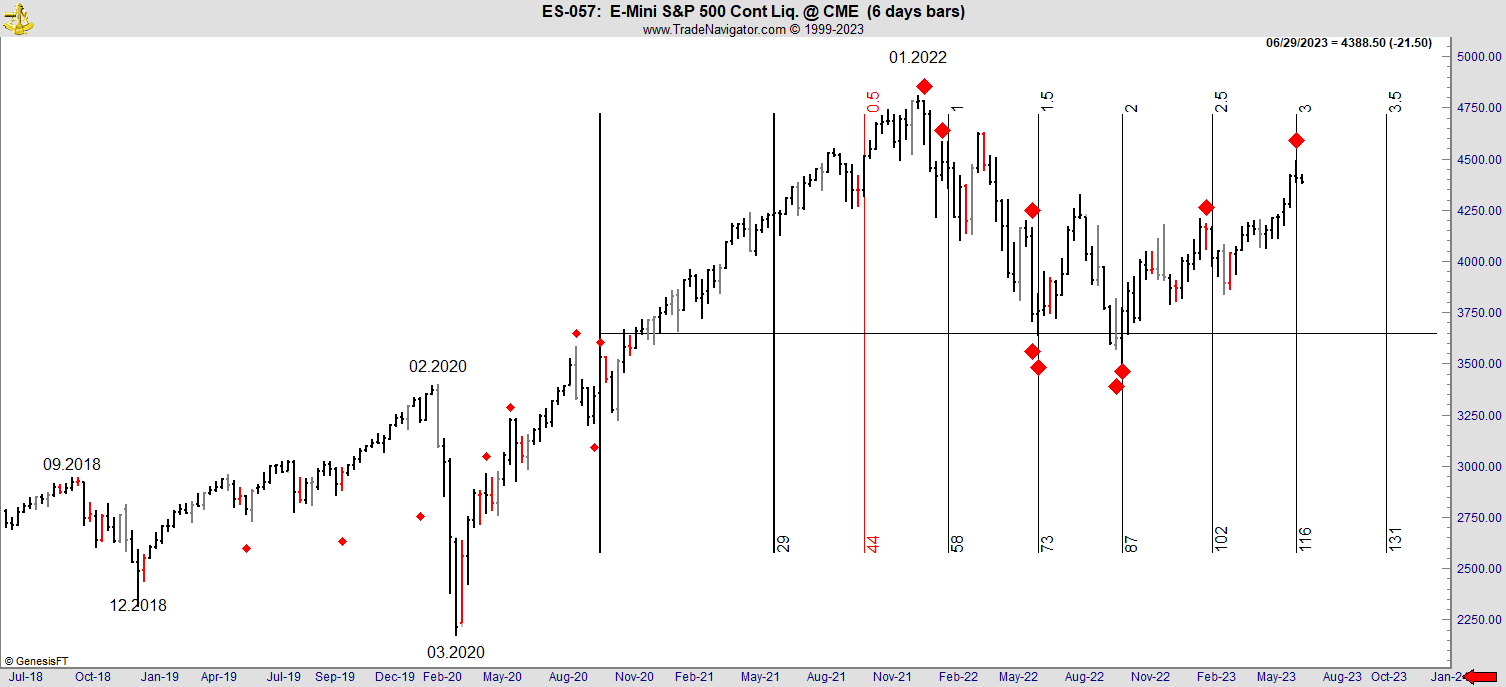
Below
you can see our old friend the 80 cycle reapearing whilst after the 01/2022 top
we see the 33 cycle called the ‘Trine’ working. The Trine is most unusual on
Futures charts and is more usually associated with large cap stocks.
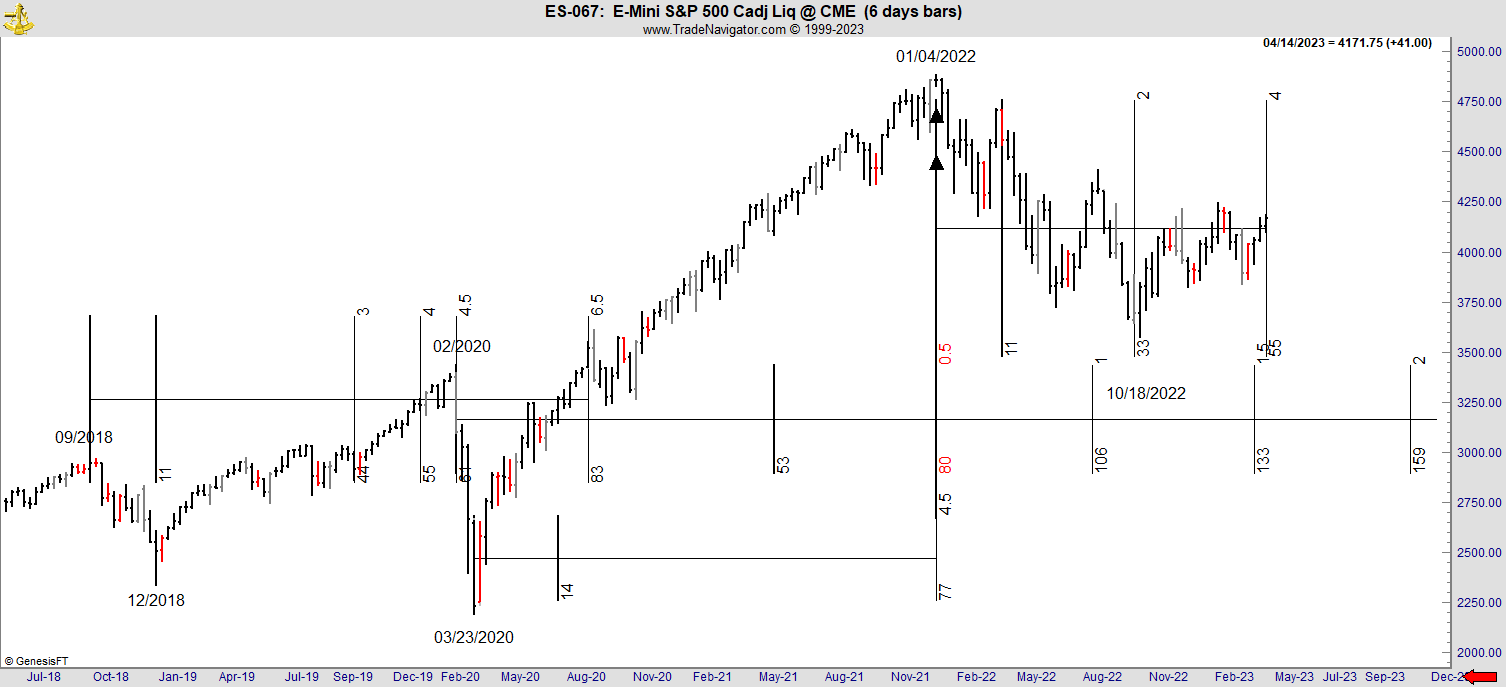
6 day chart of S&P 500
Futures
Recall that the dominant Time ratios for this market
are 29 and 58. Time as 29.5 days creates 59 as Times so they are
interchangeable.
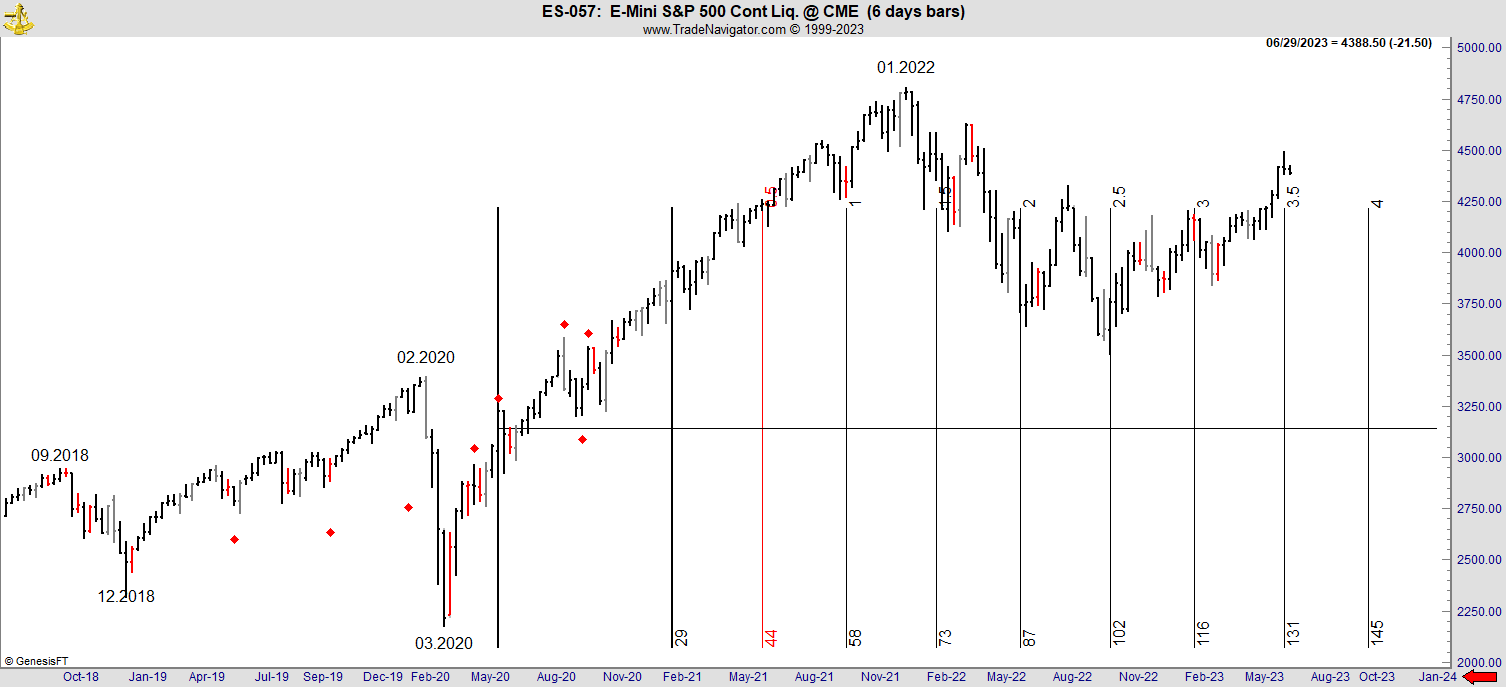
S&P Emini
Futures on a 6-day chart.
Running our base 29 cycle from the important 09/2018
swing high creates the small red diamond dates on the chart above. And we know
that Time repeats, doubles and halves so simply using a few of the important
cycles around the 09/2018 and 02/2020 flash crash corrections goes on to show
us every important cycle ending since the 2022 top.
These cycles are by no means exclusive but they do
highlight the massive advantage that accrues from an understanding of trading
Time.
S&P 500 Emini
Futures on a 6-day chart.
Remember that on the very first chart in this document
we compared the different high to high measurement from the 2000 Dot.Com swing
high to the 2007 swing high on the S&P Index and its Futures on the 24 day
chart. Recall that the Futures measurement was 80 and now we see it again on
the 6 day chart at a different level now revolving around the important 2018
and 2020 corrections. We take the 80 cycle from the closing high of the 2018
correction and the swing high of the major 2020 correction and they combine to
give us the January 2022 all-time high. Precisely!
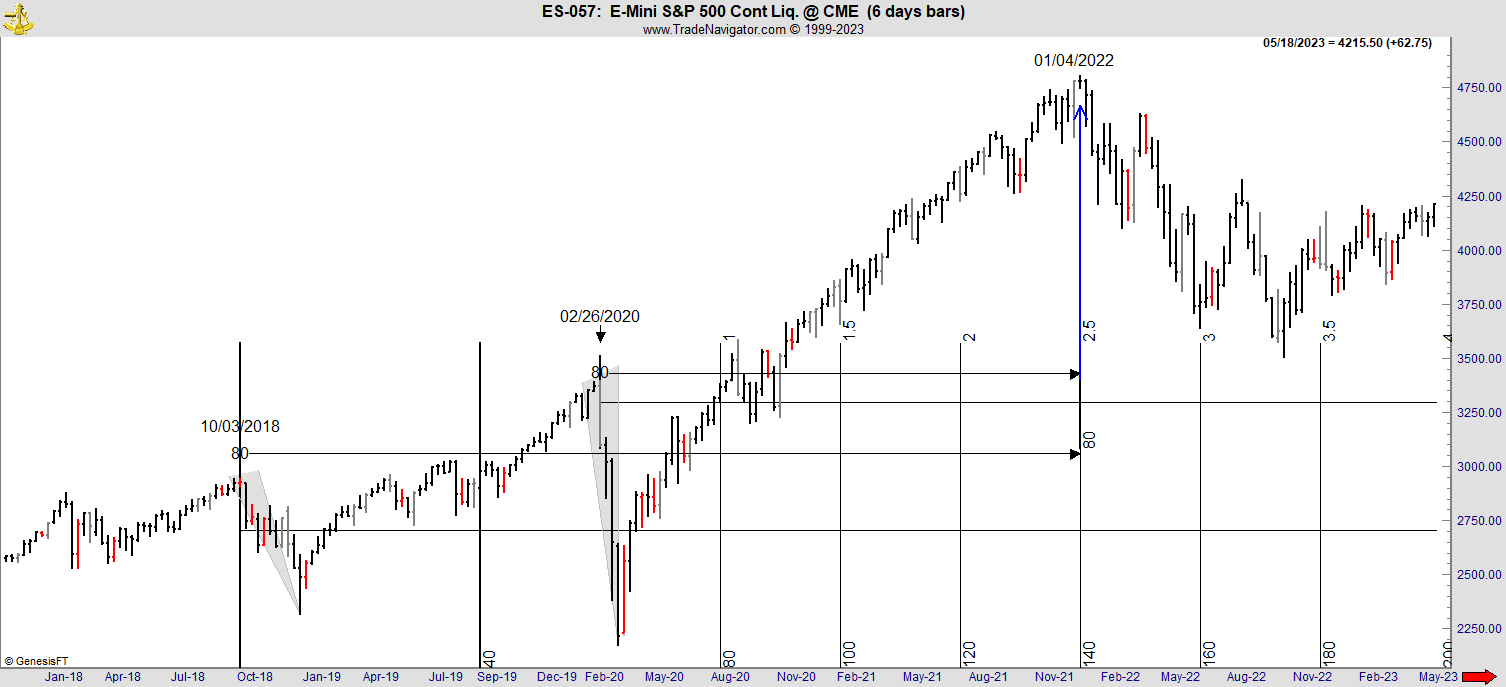
6 day S&P
Emini Futures chart
The Daily Charts-S&P
As we go down the Time cycles, we have more inflection
points and, therefore, more trade signals. We have better ways of trading daily
charts, but the chart below will suffice. Note that for the S&P daily
below, we are using simple swing analysis to highlight the market moves and
then the length of each respective swing to create its own Time cycle.
Basically, we can expect to get every turn on a daily chart identified and
signalled in advance.
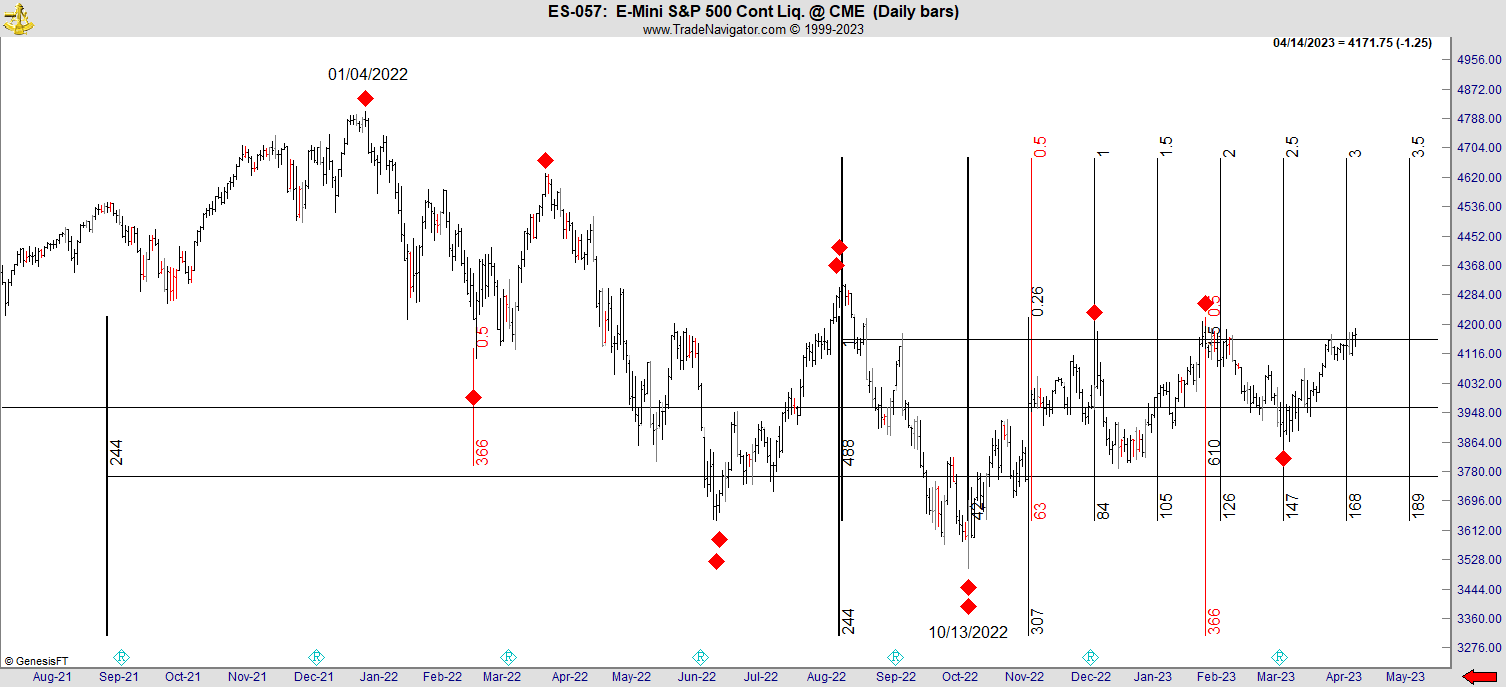
S&P 500 Emini
Futures on a daily chart.
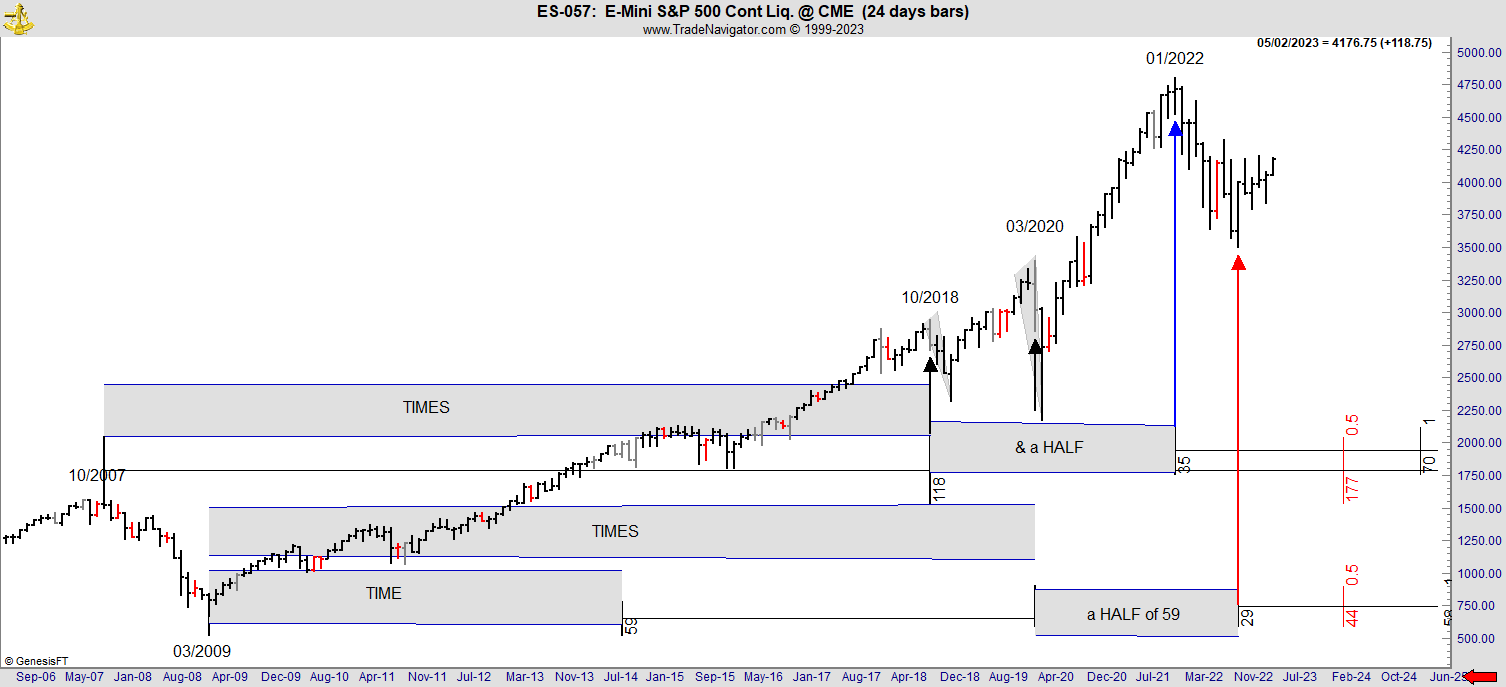
What about Price?
We know that the 2007 to 2009 leg of the MBS, CDO, and
GFC carnage has ruled future Time cycles, and since Time and Price are the
same thing on a different axis, it is no surprise that the 2009 to 2022 Bull
Market ran up precisely 4.5 times the 2007 to 2009 final leg down.
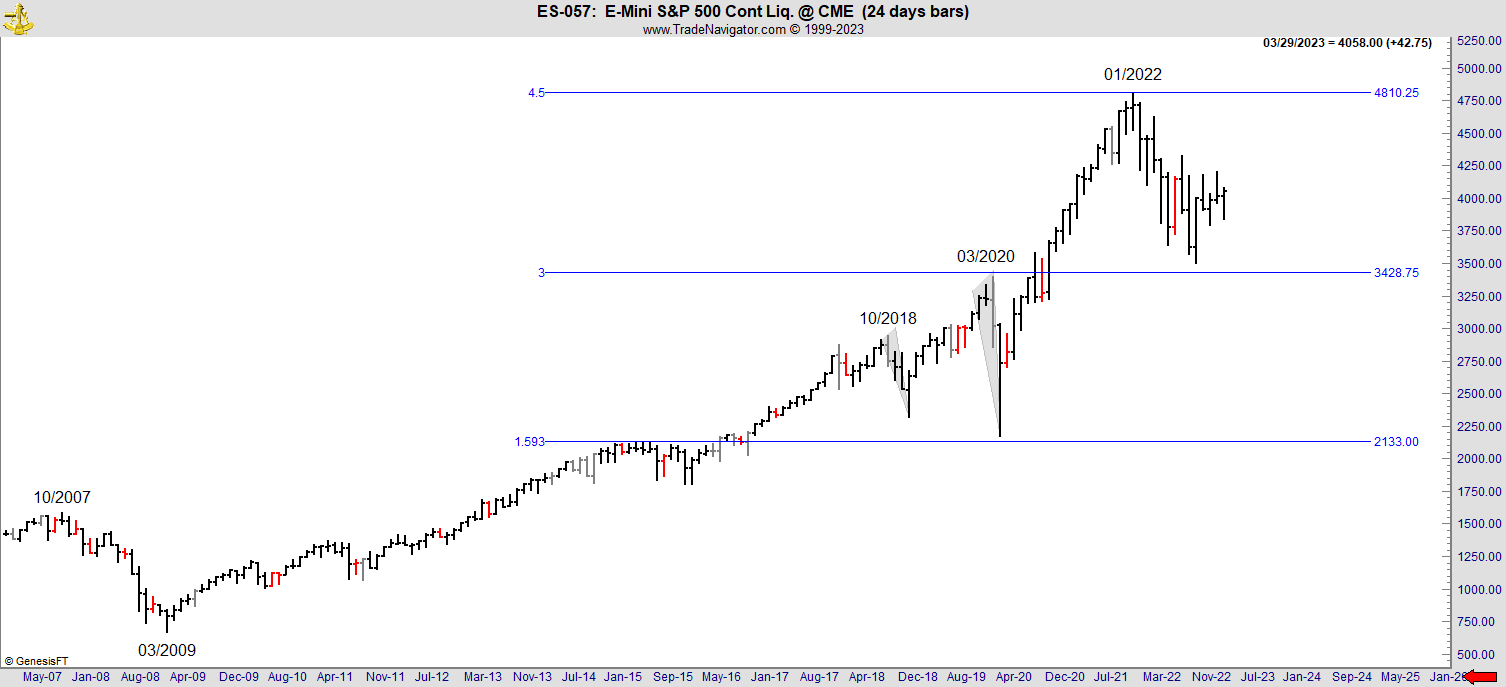
S&P 500 Emini
Futures contract on a 24-day chart.
The muted pullback from the 2022 high has been in
perfect Danielcode retracements. First to the 2019 swing low and then the 2020
swing low, each marked by the repeating 59 cycles from the 2007 high and 2009
low.
S&P 500 Emini
Futures contract on a 12-day chart.
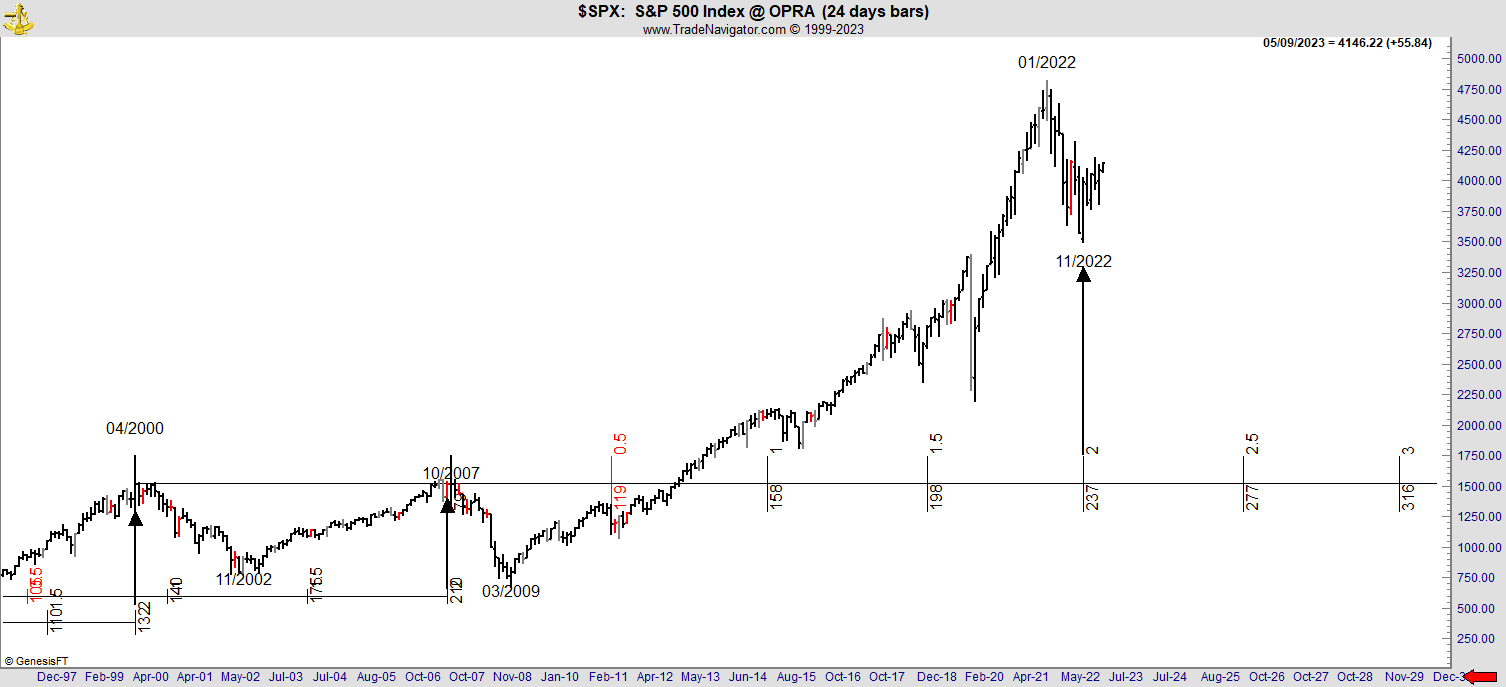
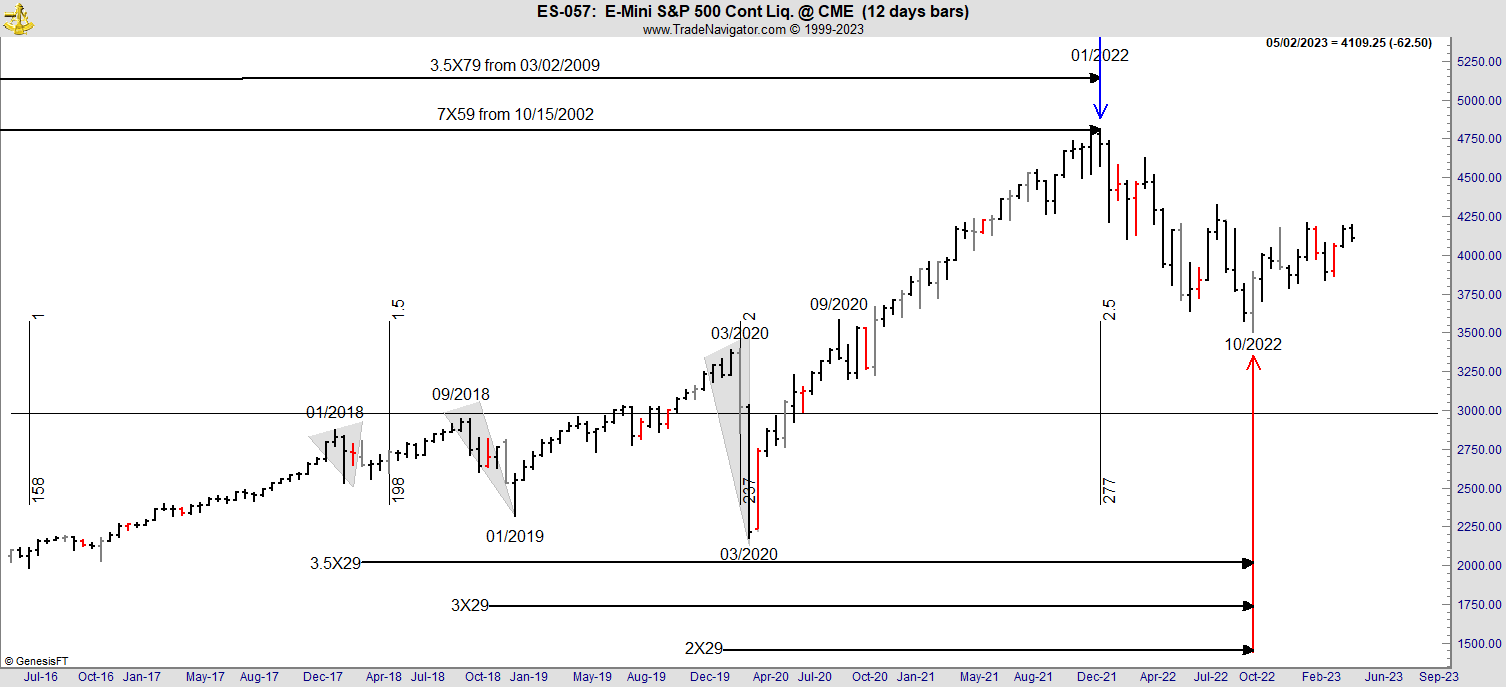
Let me show you how prescient Daniel’s Code is. You
will recall that the code states Time progresses as Time, Times and a half.
Here is the definitive Time chart on S&P since the 2002 low which was the
Dot.Com crash.
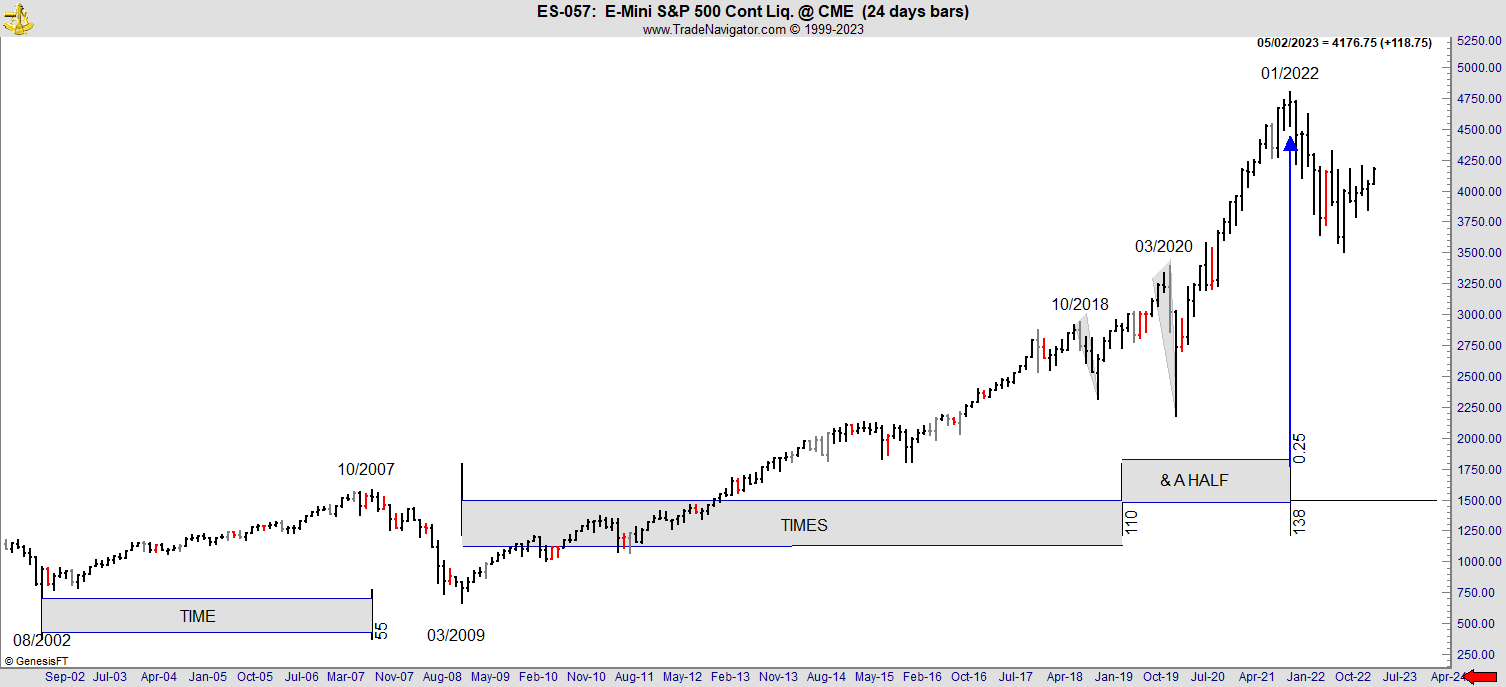
S&P 500
Futures contract on a 24-day chart.
And…
S&P 500 Emini
Futures contract on a 24-day chart.
Time, Times and a half – the endless cycle of Time.
Application of the Danielcode is not simply restricted
to the markets discussed above. Indeed, at the Danielcode we emphasise this is
not a simple theoretical exercise in pondering the market turns but has
immediate real-world benefits. See the following chart:
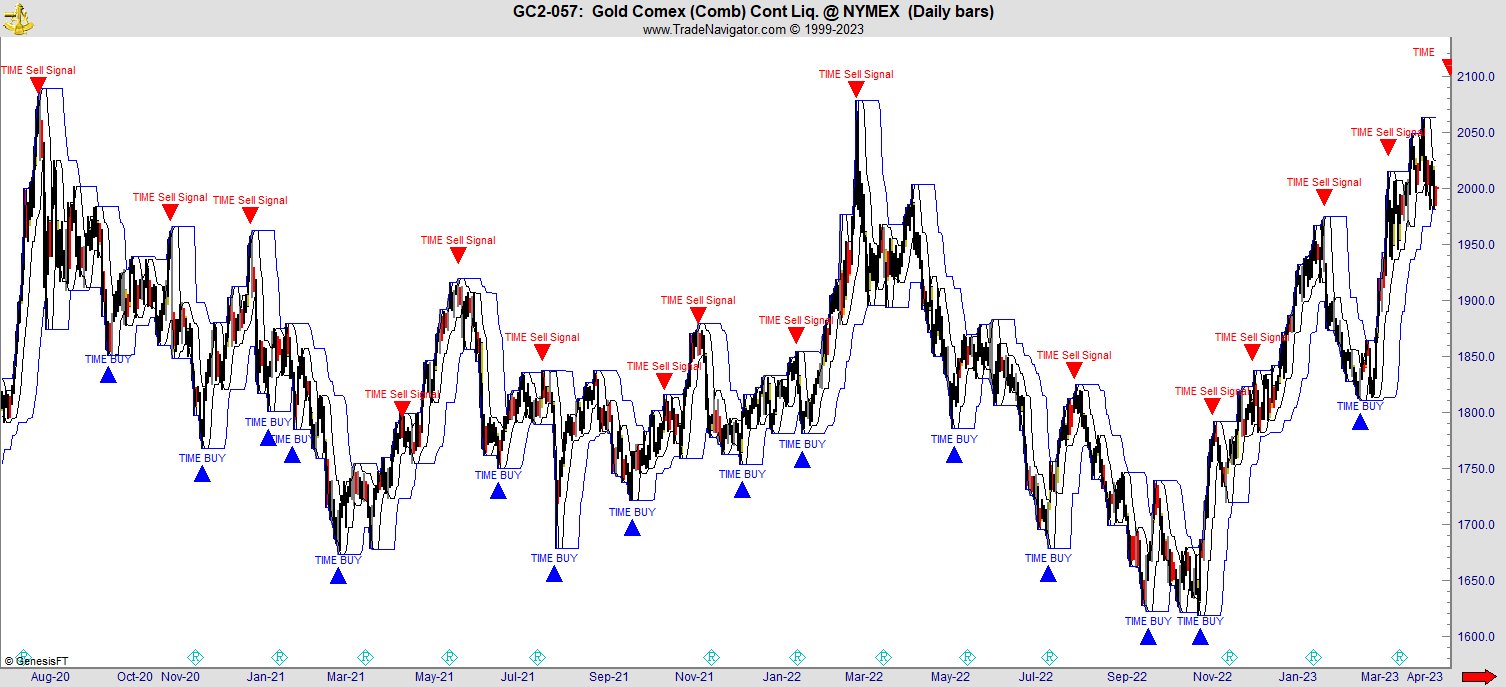
This is a daily chart of Comex Gold Futures from July
2020 to April 2023 or almost three years. I have simply used our basic 29.6 Time
cycle to create these Buy and Sell signals. These are not the only signals
created but it illustrates starkly that every important turn without exception
comes at a Danielcode Time Cycle. We trade significantly shorter Time signals
which in a similar vein allow us to capture every turn and to see those Time
signals days in advance. Using shorter but compatible Time cycles ensures you
will never miss an important market turn. Time trading is a whole new universe
and works exactly the same for all Futures and Forex markets. Do you see it
now?
 The other way to market
knowledge, predictability, and substantially increased profit.
The other way to market
knowledge, predictability, and substantially increased profit.
If you have found this article interesting, please
share it with a friend and visit us at www.thedanielcode.com where we work every day to
make you a better, safer, and stronger trader.
John Needham is an Australian Attorney who lives on
Queensland’s Gold Coast and trades, teaches, and thinks about what makes
markets turn.
John Needham
17 July 2023
© John Needham 2023
Disclaimer: All the reports, charts and content in the Danielcode web site are for educational purposes only and do not constitute trading advice nor an invitation to buy or sell securities. The views are the personal views of the author only and should be treated as such. Before acting on any of the ideas expressed, the reader should seek professional advice from a licensed broker in the appropriate jurisdiction.
Risk Disclosure for Front Page, Long Term Trend Charts: THE RISK OF LOSS TRADING COMMODITIES OR FUTURES CAN BE SUBSTANTIAL. COMMODITY TRADING HAS LARGE POTENTIAL RISKS, IN ADDITION TO ANY POTENTIAL REWARDS. YOU MUST BE AWARE OF THE RISKS AND BE WILLING TO ACCEPT THEM IN ORDER TO INVEST IN THE FUTURES OR COMMODITIES MARKETS. DON'T TRADE WITH MONEY YOU CAN'T AFFORD TO LOSE. THIS IS NEITHER A SOLICITATION NOR AN OFFER TO BUY OR SELL COMMODITY INTERESTS. THE USE OR PLACEMENT OF ANY STOP-LOSS OR STOP-LIMIT ORDERS MAY NOT LIMIT YOUR LOSSES AND YOU COULD LOSE MORE THAN YOUR INTENDED AMOUNT OF MONEY AT RISK. PAST PERFORMANCE OF ANY TRADING SYSTEM OR METHODOLOGY IS NOT INDICATIVE OF FUTURE RESULTS.
Risk Disclosure for Genie Results, T.03, T.03+ and TradeProgram: HYPOTHETICAL PERFORMANCE RESULTS HAVE MANY INHERENT LIMITATIONS, SOME OF WHICH ARE DESCRIBED BELOW. NO REPRESENTATION IS BEING MADE THAT ANY ACCOUNT WILL OR IS LIKELY TO ACHIEVE PROFITS OR LOSSES SIMILAR TO THOSE SHOWN; IN FACT, THERE ARE FREQUENTLY SHARP DIFFERENCES BETWEEN HYPOTHETICAL PERFORMANCE RESULTS AND THE ACTUAL RESULTS SUBSEQUENTLY ACHIEVED BY ANY PARTICULAR TRADING PROGRAM. ONE OF THE LIMITATIONS OF HYPOTHETICAL PERFORMANCE RESULTS IS THAT THEY ARE GENERALLY PREPARED WITH THE BENEFIT OF HINDSIGHT. IN ADDITION, HYPOTHETICAL TRADING DOES NOT INVOLVE FINANCIAL RISK, AND NO HYPOTHETICAL TRADING RECORD CAN COMPLETELY ACCOUNT FOR THE IMPACT OF FINANCIAL RISK OF ACTUAL TRADING. FOR EXAMPLE, THE ABILITY TO WITHSTAND LOSSES OR TO ADHERE TO A PARTICULAR TRADING PROGRAM IN SPITE OF TRADING LOSSES ARE MATERIAL POINTS WHICH CAN ALSO ADVERSELY AFFECT ACTUAL TRADING RESULTS. THERE ARE NUMEROUS OTHER FACTORS RELATED TO THE MARKETS IN GENERAL OR TO THE IMPLEMENTATION OF ANY SPECIFIC TRADING PROGRAM WHICH CANNOT BE FULLY ACCOUNTED FOR IN THE PREPARATION OF HYPOTHETICAL PERFORMANCE RESULTS AND ALL WHICH CAN ADVERSELY AFFECT TRADING RESULTS.