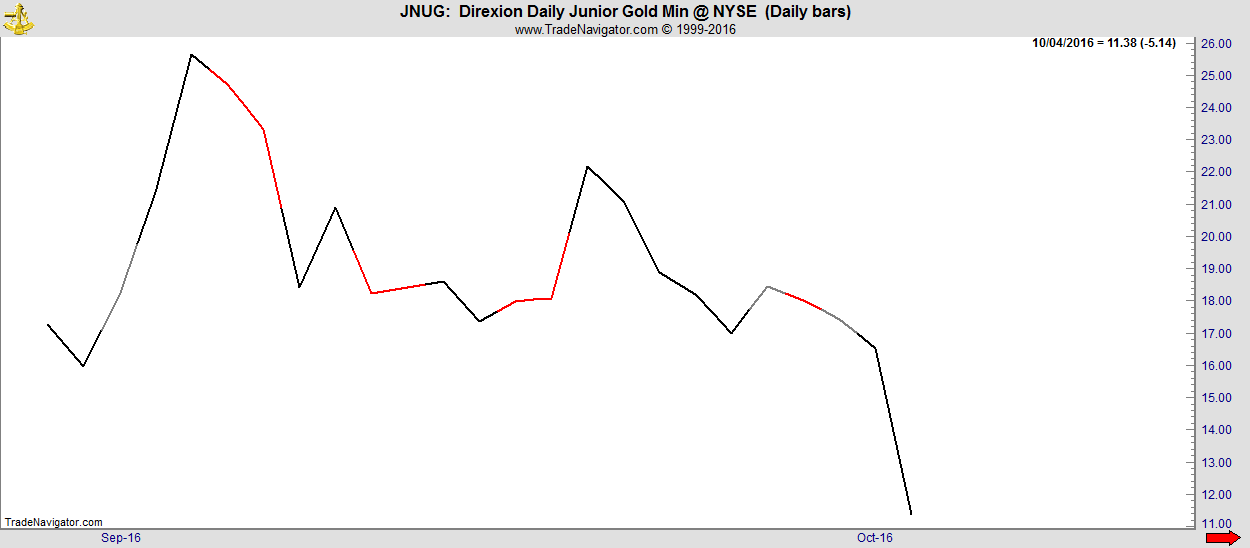
Gold and Silver took a hammering today 10/04/16 with Comex Gold now down almost 5% from its late September high and a lovely 412 points on Thursday. Silver matched this to close down 104 points on the day. These Comex markets are broad and deep but to see what happens in thinner markets just take a look at Bloomberg's article today "This Year's Super-Hot Gold Mining ETF Is Now Getting Destroyed" which features the ultra-leveraged Direxion Daily Junior Gold Miners Index Bull 3x Shares ETF (JNUG), down more than 22 percent as of 11:30am New York Time, with the precious metal off more than 2 percent on the day. That's what you call leveraging leverage!!
Our preferred trading vehicle the Comex Futures markets for Precious Metals seems positively conservative by comparison but still yielded $4350 per one contract on the day as it ran down perfectly to DC support at 1269.2.
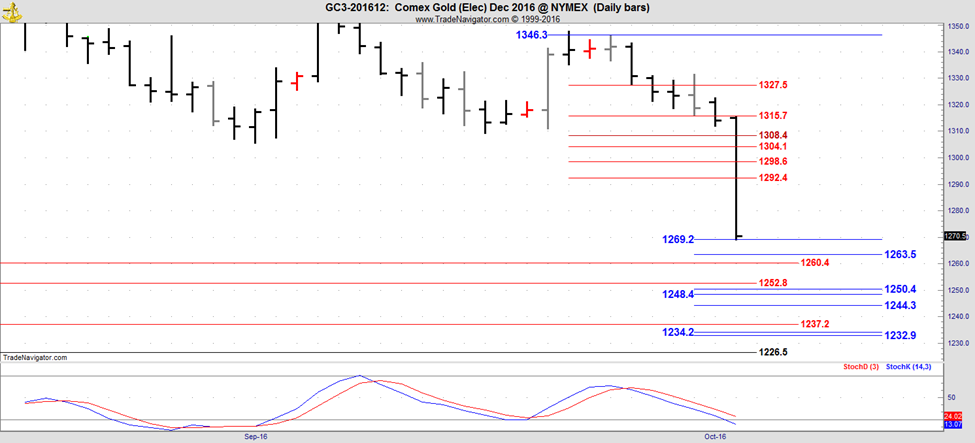
Note how added volatility aka panic simply works to make the market recognition of the Danielcode numbers just as accurate as normal. This is a marked contrast to most other ideas of support and resistance and should give you food for thought.
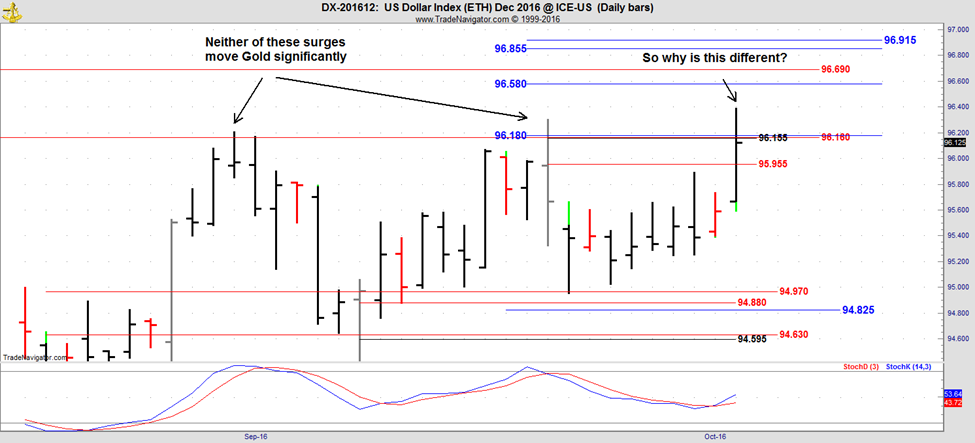
Most comment on today's blowout of the old lows focuses on a stronger US Dollar or anticipation thereof, but there is little empiric evidence to support this view:
A better answer to the big questions of "Why here and why today" is apparent from our weekly Gold chart which I showed you at last Thursday's webinar:
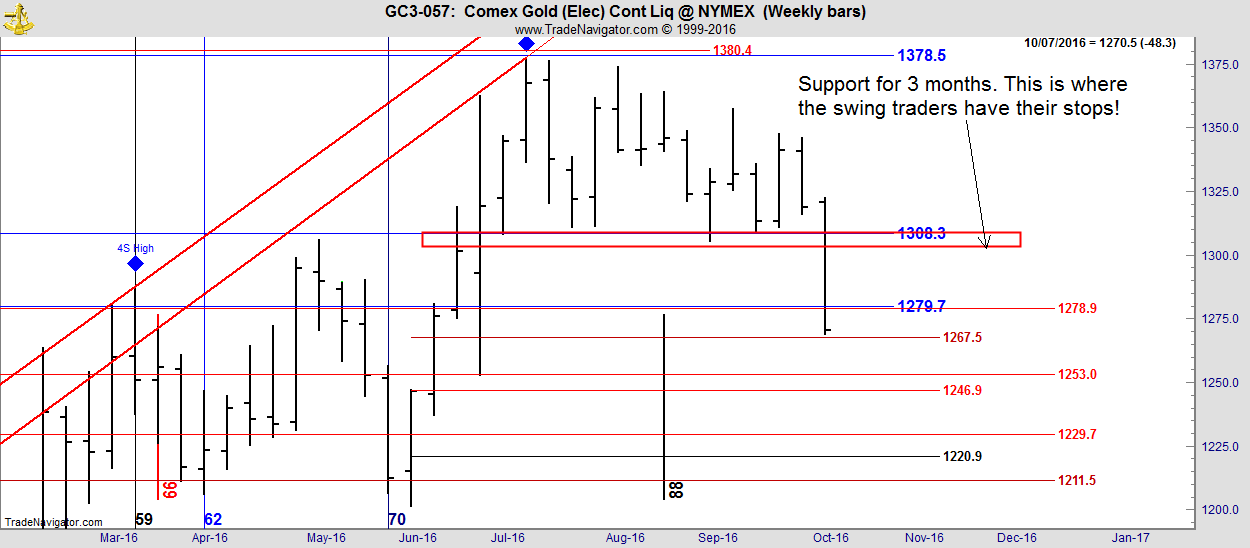
Support on the weekly chart has held near the DC blue line at 1308.3 for 90 days and this is where the swing traders had all of their stops. So a break of the old support created a vast supply of old stop loss orders to feed the bear side as it cleaned out the Gold optimists. Interestingly on the weekly chart the market is picking the alternate 62.5% retracement so far rather than the much more genuine DC "Time" support. Largely we view 62.5% support as the NFI number that traders use when they really don't have real support. This is a function of the extensive teaching of Fibonacci levels as support and resistance in financial markets a hopelessly misplaced understanding of Fibs which were originally developed to describe the breeding cycles of Rabbits in an optimum population. HA!
Finally to show how orderly and predictable this particular market is, let's take a look at the Daily chart I showed last week and bring it up to date to see how easily this whole run down has been traded:
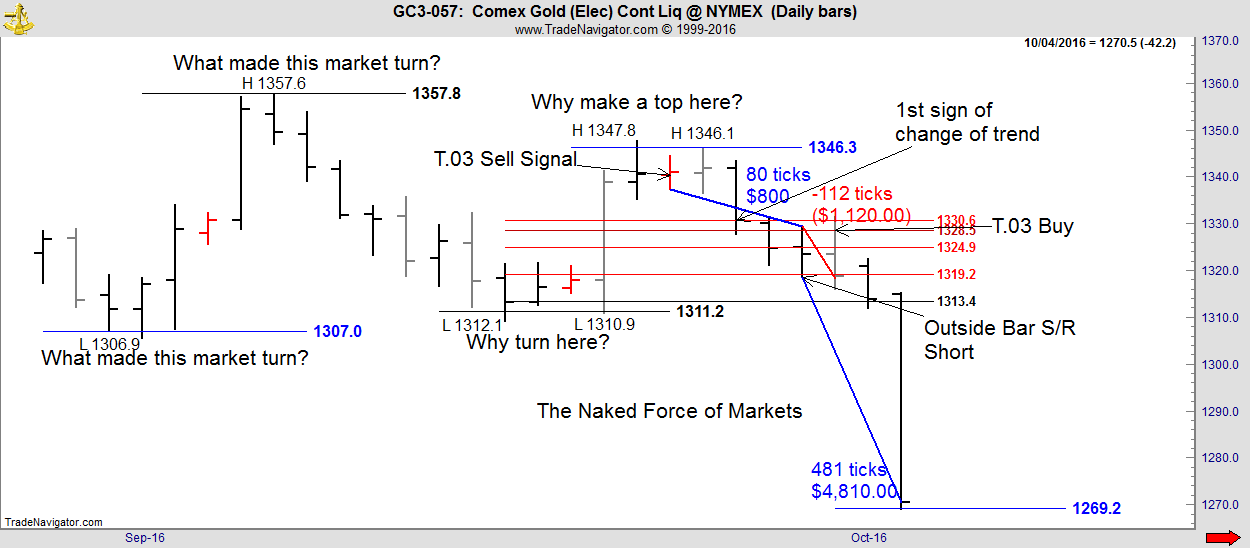
Nice enough!!
Please visit us at www.thedanielcode.com where there is much to learn.
"The fox knows many things, but the hedgehog knows one big thing. A Hedgehog Concept is not a goal, intention or strategy to be the best. It is an understanding of what you can be best at. The distinction is absolutely crucial". ~ Isaiah Berlin, The Hedgehog and the Fox
Disclaimer: All the reports, charts and content in the Danielcode web site are for educational purposes only and do not constitute trading advice nor an invitation to buy or sell securities. The views are the personal views of the author only and should be treated as such. Before acting on any of the ideas expressed, the reader should seek professional advice from a licensed broker in the appropriate jurisdiction.
Risk Disclosure for Front Page, Long Term Trend Charts: THE RISK OF LOSS TRADING COMMODITIES OR FUTURES CAN BE SUBSTANTIAL. COMMODITY TRADING HAS LARGE POTENTIAL RISKS, IN ADDITION TO ANY POTENTIAL REWARDS. YOU MUST BE AWARE OF THE RISKS AND BE WILLING TO ACCEPT THEM IN ORDER TO INVEST IN THE FUTURES OR COMMODITIES MARKETS. DON'T TRADE WITH MONEY YOU CAN'T AFFORD TO LOSE. THIS IS NEITHER A SOLICITATION NOR AN OFFER TO BUY OR SELL COMMODITY INTERESTS. THE USE OR PLACEMENT OF ANY STOP-LOSS OR STOP-LIMIT ORDERS MAY NOT LIMIT YOUR LOSSES AND YOU COULD LOSE MORE THAN YOUR INTENDED AMOUNT OF MONEY AT RISK. PAST PERFORMANCE OF ANY TRADING SYSTEM OR METHODOLOGY IS NOT INDICATIVE OF FUTURE RESULTS.
Risk Disclosure for Genie Results, T.03, T.03+ and TradeProgram: HYPOTHETICAL PERFORMANCE RESULTS HAVE MANY INHERENT LIMITATIONS, SOME OF WHICH ARE DESCRIBED BELOW. NO REPRESENTATION IS BEING MADE THAT ANY ACCOUNT WILL OR IS LIKELY TO ACHIEVE PROFITS OR LOSSES SIMILAR TO THOSE SHOWN; IN FACT, THERE ARE FREQUENTLY SHARP DIFFERENCES BETWEEN HYPOTHETICAL PERFORMANCE RESULTS AND THE ACTUAL RESULTS SUBSEQUENTLY ACHIEVED BY ANY PARTICULAR TRADING PROGRAM. ONE OF THE LIMITATIONS OF HYPOTHETICAL PERFORMANCE RESULTS IS THAT THEY ARE GENERALLY PREPARED WITH THE BENEFIT OF HINDSIGHT. IN ADDITION, HYPOTHETICAL TRADING DOES NOT INVOLVE FINANCIAL RISK, AND NO HYPOTHETICAL TRADING RECORD CAN COMPLETELY ACCOUNT FOR THE IMPACT OF FINANCIAL RISK OF ACTUAL TRADING. FOR EXAMPLE, THE ABILITY TO WITHSTAND LOSSES OR TO ADHERE TO A PARTICULAR TRADING PROGRAM IN SPITE OF TRADING LOSSES ARE MATERIAL POINTS WHICH CAN ALSO ADVERSELY AFFECT ACTUAL TRADING RESULTS. THERE ARE NUMEROUS OTHER FACTORS RELATED TO THE MARKETS IN GENERAL OR TO THE IMPLEMENTATION OF ANY SPECIFIC TRADING PROGRAM WHICH CANNOT BE FULLY ACCOUNTED FOR IN THE PREPARATION OF HYPOTHETICAL PERFORMANCE RESULTS AND ALL WHICH CAN ADVERSELY AFFECT TRADING RESULTS.