Traders, Bankers, Commentators and the whole panoply of the
trading world are obsessive in their search for the one study, tool or device
which is going to enhance their trading and resultant profits. The trading
world is awash with tools and studies that profess to determine trend,
strength, exit targets and anything else you can think of but I maintain that
nothing compares with the Danielcode chart number. I have been using these price
levels for the past twenty-eight years and we have presented them in the public
domain at www.thedanielcode.com since late 2008.
Trigger Warning: This article uses some maths and a bit of
geometry. If you are not into numbers don’t panic as we do all the calculations
for you.
In that time we have created over 40,000 Members charts which
list the important price levels in the Futures and Forex markets we cover. Members
Charts are created every weekend and on Wednesday evening and more often as
required. We call these price levels “targets” and target recognition is
achieved in a very special way; in a rallying market target recognition is
achieved at the bar high or the close. In a pullback target recognition is
achieved at the bar low or the close. Additionally that target recognition is
only valid if the Bar high/low or close is within 0.1% of the target Not 1% but
0.1% or 1 tenth of 1% so it is very specific. Since the website started in 2008
each of the Members charts is posted on the website on the day they are created
and after 30 days those charts are automatically posted to the Chart Archives
tab. Take a look at these over 45,000 charts created since 2008 and you will be
hard pressed to find a market that has turned anywhere except at its DC numbers.
In fact we maintain that markets turn at and only at the DC numbers.
 Theoretically the
DC ratios run from zero to infinity but fortunately markets continually select
the same five patterns over 92% of the time and it is these patterns which
populate our members charts. But there is more; going on a deep dive of the
DC Time and Price ratios reveals a plethora of minor cycles which we monitor on
a daily basis. We don’t want to crowd out our charts with all the possible
levels so we post the primary levels but monitor the additional probabilities
for signal opportunities. So we are a bit like the beautiful swan cruising along
the placid lake. Above the water all is calm and peaceful. Below the water the
picture is reversed as the swan paddles fiercely to push itself along. As a
matter of interest black swans are common down under!
Theoretically the
DC ratios run from zero to infinity but fortunately markets continually select
the same five patterns over 92% of the time and it is these patterns which
populate our members charts. But there is more; going on a deep dive of the
DC Time and Price ratios reveals a plethora of minor cycles which we monitor on
a daily basis. We don’t want to crowd out our charts with all the possible
levels so we post the primary levels but monitor the additional probabilities
for signal opportunities. So we are a bit like the beautiful swan cruising along
the placid lake. Above the water all is calm and peaceful. Below the water the
picture is reversed as the swan paddles fiercely to push itself along. As a
matter of interest black swans are common down under!
These DC numbers are derived from the DC Time ratios which
themselves are simply fractals of observable natural ratios that happen in our
world every day. We then use these Time ratios as Price ratios as Time and
Price are the same thing on different axis. That may surprise you but hold fire
until you see how accurately these Time cycles delineate Price. Our assumption
about charts is that all available knowledge of market forces is known by the
market and must be revealed in its Price action. Let’s start with a detailed
analysis of the S&P Emini chart one of the most traded and popular markets
of all. The swings immediately either side of an important high or low set the
scene for what follows. The charts themselves create all of the strategy that
follows.
This is the September 2022 Emini chart which gave us the 01/04/2022
all-time high and the important 03/17/2022 low.
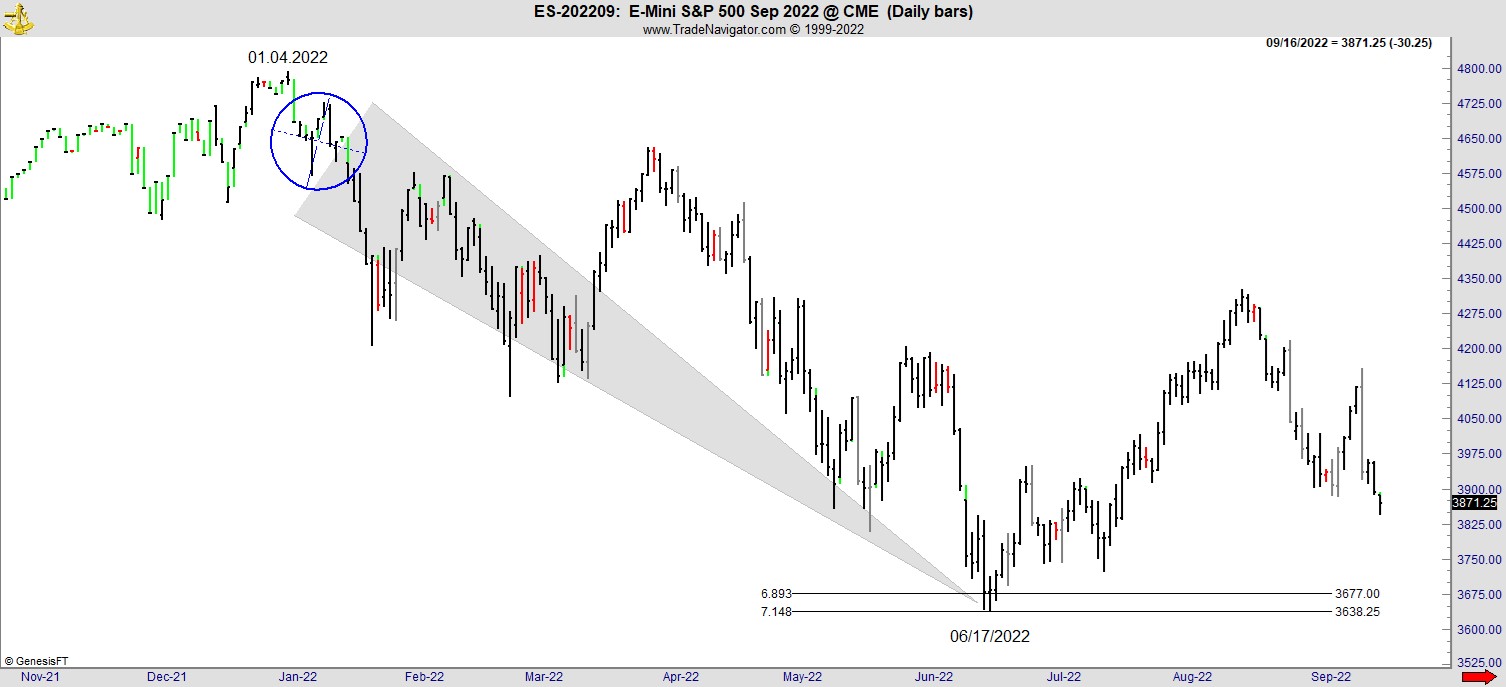
The first retracement after the all-time high gives you the
chart low and the closing low 1n June 2022. The close of 06/16 was 3680.00
against the DC target at 3677.00. The variance between market and the relevant
DC number is 3 points and the allowable variance at 0.1% for this price level
is 3.68 points. Ergo we have target recognition. The next day 06/17/2022 gives
us the then low for this pullback at 3639.00 against the DC number at 3638.25
and with a variance from target of just 0.75 we again have target recognition. And
from that low we had the “most hated rally” because most of the hedgies missed the turn and the rally ran 689 points or
almost 59% (a DC ratio) of the whole move down to 06/2022. Note that the
January high came in the March 2022 contract whilst the June low came in the September
2022 contract. We have made no adjustments on rollover.
Let’s turn to the rally which happens on the September 2022 chart.
These DC numbers work exactly the same on the index or on a continuous chart
provide it is not back adjusted.
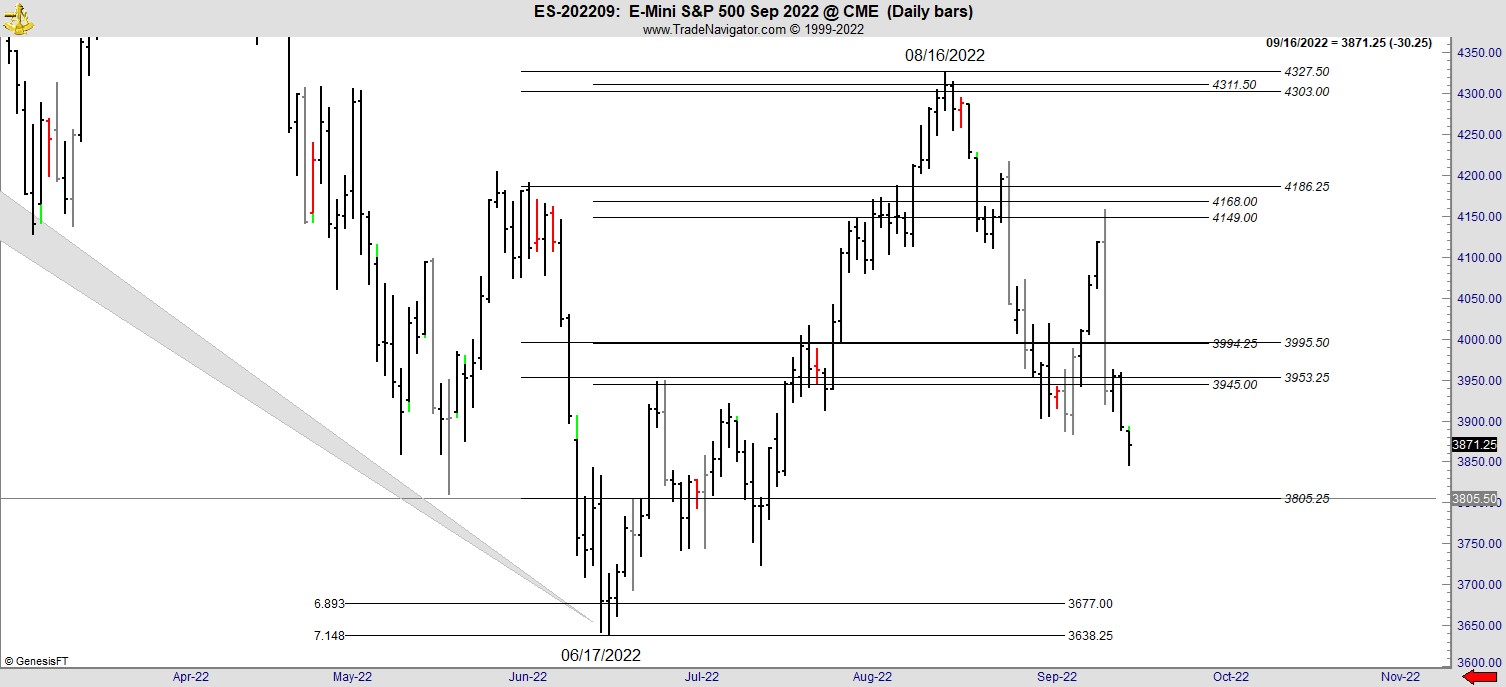
Using simply the swing immediately before and immediately
after the 03/17 low we have got every important high of the rally either at the
high or the close on the relevant bar. When you consider that all turns happen after
target recognition you can see what a huge advantage the DC ratios give you.
Let’s move now to the December 2022 ES chart to find the
significant vibrations for this last leg down.
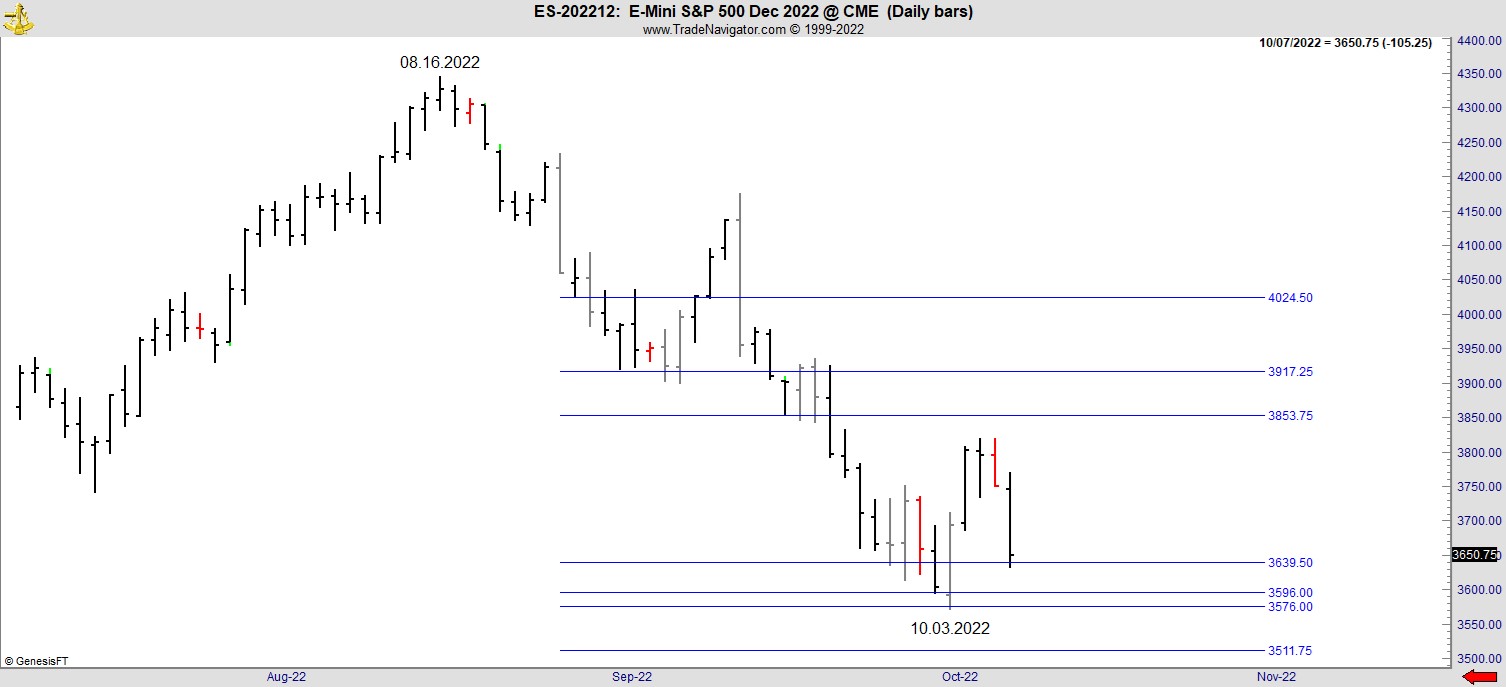
The low on Friday 09/30 was 3595.25 lust three tics variance
from the blue line at 3596.00 and that was target recognition which setup the
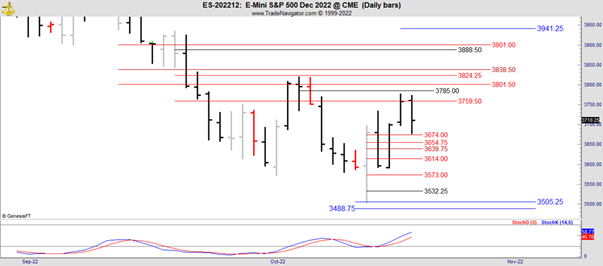
Buy signal for the new week. To get you right up to date, below is the current
S&P Emini Futures chart. Thursday 10/13/22 lived up to its unlucky date but
still managed to tag the DC Blue line at the current low. And there you have
it. Even as this market ponders its future direction it does so with strict
observance of the DC ratios at its high/low or close:
The prerequisite for any market turn whether small or
big is DC target recognition. All markets turn at and only at the Danielcode
ratios. By using these amazing support and resistance ratios your trading will
be a deal better.
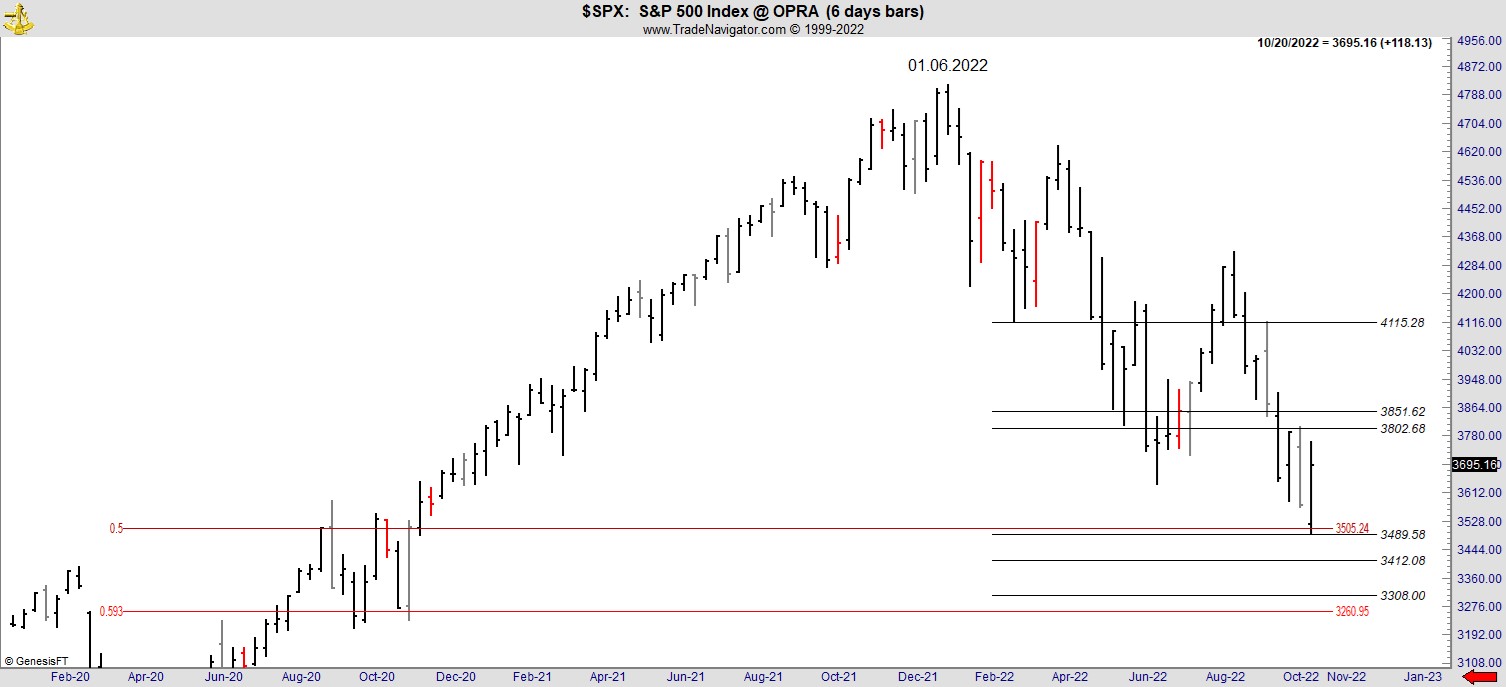
Finally a close above 3577.03
on the index chart $SPX will confirm a key reversal bar on the 6 day chart
which completes its current bar on Thursday. A KRB from known DC support is a
powerful directional signal. Additionally the index has bottomed for now just a
few points below the 50% retracement and that may be sufficient for a while.
We invite you to visit us at www.thedanielcode.com to see what we do. A free trial is
available. John Needham is an Australian  Attorney who has been trading Futures and Forex since 1994 and teaching
folks to trade since 2004
Attorney who has been trading Futures and Forex since 1994 and teaching
folks to trade since 2004
20 October 2022
Disclaimer: All the reports, charts and content in the Danielcode web site are for educational purposes only and do not constitute trading advice nor an invitation to buy or sell securities. The views are the personal views of the author only and should be treated as such. Before acting on any of the ideas expressed, the reader should seek professional advice from a licensed broker in the appropriate jurisdiction.
Risk Disclosure for Front Page, Long Term Trend Charts: THE RISK OF LOSS TRADING COMMODITIES OR FUTURES CAN BE SUBSTANTIAL. COMMODITY TRADING HAS LARGE POTENTIAL RISKS, IN ADDITION TO ANY POTENTIAL REWARDS. YOU MUST BE AWARE OF THE RISKS AND BE WILLING TO ACCEPT THEM IN ORDER TO INVEST IN THE FUTURES OR COMMODITIES MARKETS. DON'T TRADE WITH MONEY YOU CAN'T AFFORD TO LOSE. THIS IS NEITHER A SOLICITATION NOR AN OFFER TO BUY OR SELL COMMODITY INTERESTS. THE USE OR PLACEMENT OF ANY STOP-LOSS OR STOP-LIMIT ORDERS MAY NOT LIMIT YOUR LOSSES AND YOU COULD LOSE MORE THAN YOUR INTENDED AMOUNT OF MONEY AT RISK. PAST PERFORMANCE OF ANY TRADING SYSTEM OR METHODOLOGY IS NOT INDICATIVE OF FUTURE RESULTS.
Risk Disclosure for Genie Results, T.03, T.03+ and TradeProgram: HYPOTHETICAL PERFORMANCE RESULTS HAVE MANY INHERENT LIMITATIONS, SOME OF WHICH ARE DESCRIBED BELOW. NO REPRESENTATION IS BEING MADE THAT ANY ACCOUNT WILL OR IS LIKELY TO ACHIEVE PROFITS OR LOSSES SIMILAR TO THOSE SHOWN; IN FACT, THERE ARE FREQUENTLY SHARP DIFFERENCES BETWEEN HYPOTHETICAL PERFORMANCE RESULTS AND THE ACTUAL RESULTS SUBSEQUENTLY ACHIEVED BY ANY PARTICULAR TRADING PROGRAM. ONE OF THE LIMITATIONS OF HYPOTHETICAL PERFORMANCE RESULTS IS THAT THEY ARE GENERALLY PREPARED WITH THE BENEFIT OF HINDSIGHT. IN ADDITION, HYPOTHETICAL TRADING DOES NOT INVOLVE FINANCIAL RISK, AND NO HYPOTHETICAL TRADING RECORD CAN COMPLETELY ACCOUNT FOR THE IMPACT OF FINANCIAL RISK OF ACTUAL TRADING. FOR EXAMPLE, THE ABILITY TO WITHSTAND LOSSES OR TO ADHERE TO A PARTICULAR TRADING PROGRAM IN SPITE OF TRADING LOSSES ARE MATERIAL POINTS WHICH CAN ALSO ADVERSELY AFFECT ACTUAL TRADING RESULTS. THERE ARE NUMEROUS OTHER FACTORS RELATED TO THE MARKETS IN GENERAL OR TO THE IMPLEMENTATION OF ANY SPECIFIC TRADING PROGRAM WHICH CANNOT BE FULLY ACCOUNTED FOR IN THE PREPARATION OF HYPOTHETICAL PERFORMANCE RESULTS AND ALL WHICH CAN ADVERSELY AFFECT TRADING RESULTS.