Market traders and particularly the options guys love to talk about the Greeks, Beta, Theta, Gamma and so on. None of that applies to us although it is a result of our daily bar analysis but in an effort to simplify our continuous search for important turning points I have decided to call that largely invisible point “Ping”. And what we mean by “Ping” is that magical point where markets achieve equilibrium in Time and Price or as we say “Time and Price are Squared”. This is not an original idea as it was first coined by WD Gann whose work occupied fully twelve years of my life and an inordinate amount of money before I dumped Gann into the lexicon of other interesting but failed systems and moved on in search of the Danielcode. Gann’s take on Time and Price Squared posited that this Nirvana was reached when markets met one of his angular lines, themselves having qualities of both Time and Price. As such their stretch is virtually unlimited and this is its chronic weakness. This article was written over several days so each chart adds more data.
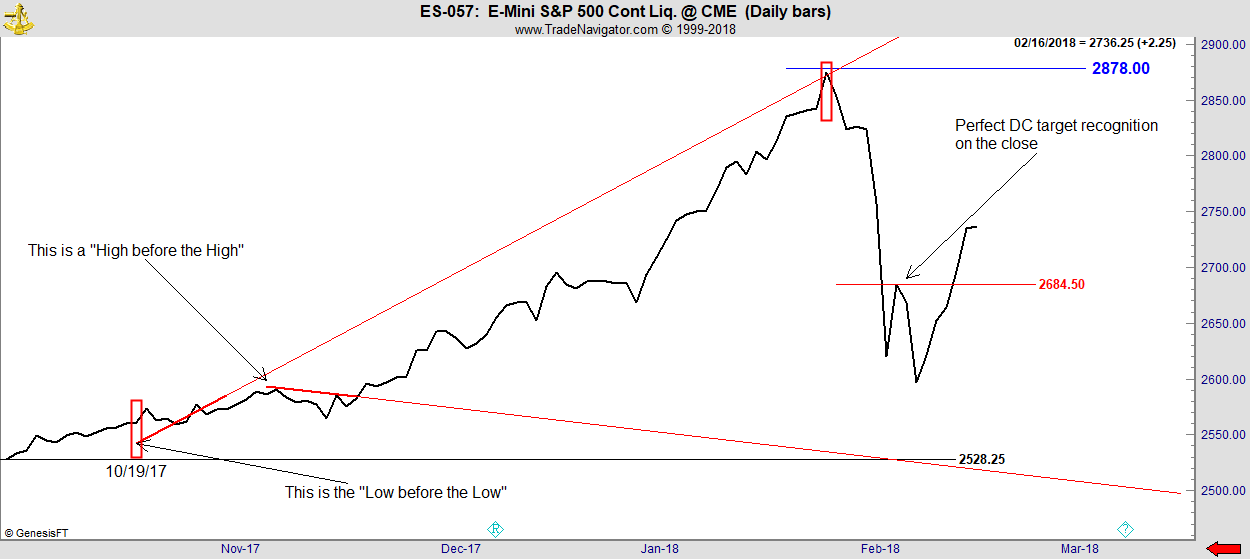
By contrast The Danielcode finds Time and Price Squared when markets are at a known DC Price level and at a known DC Time cycle expiration. Our DC Members Charts update on the evening of 01/24/18 below gave the next few levels in the S&P Emini March contract. 2878 as a future resistance level is clearly posted:
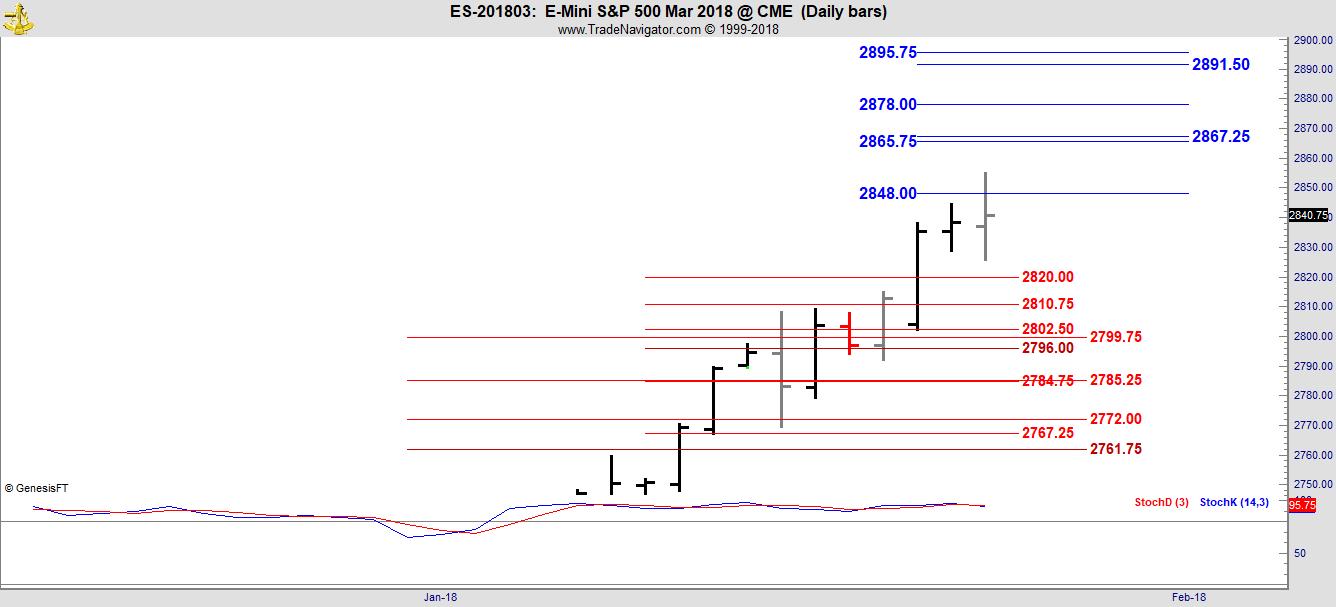
The red retracement levels shown on this chart are valid at the time of posting but will change as the market makes new highs.
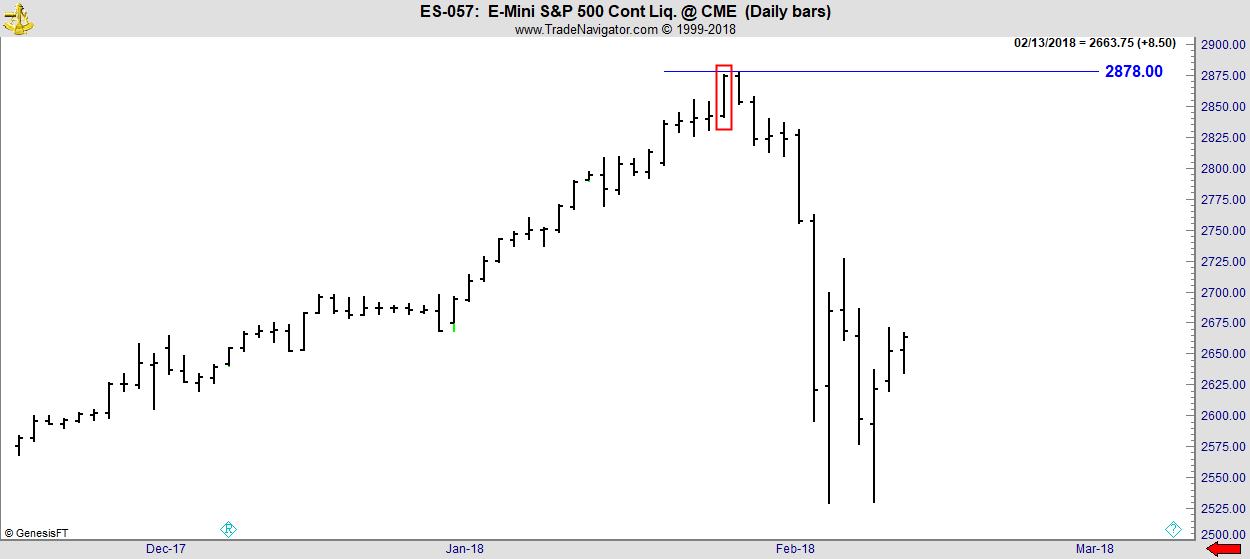
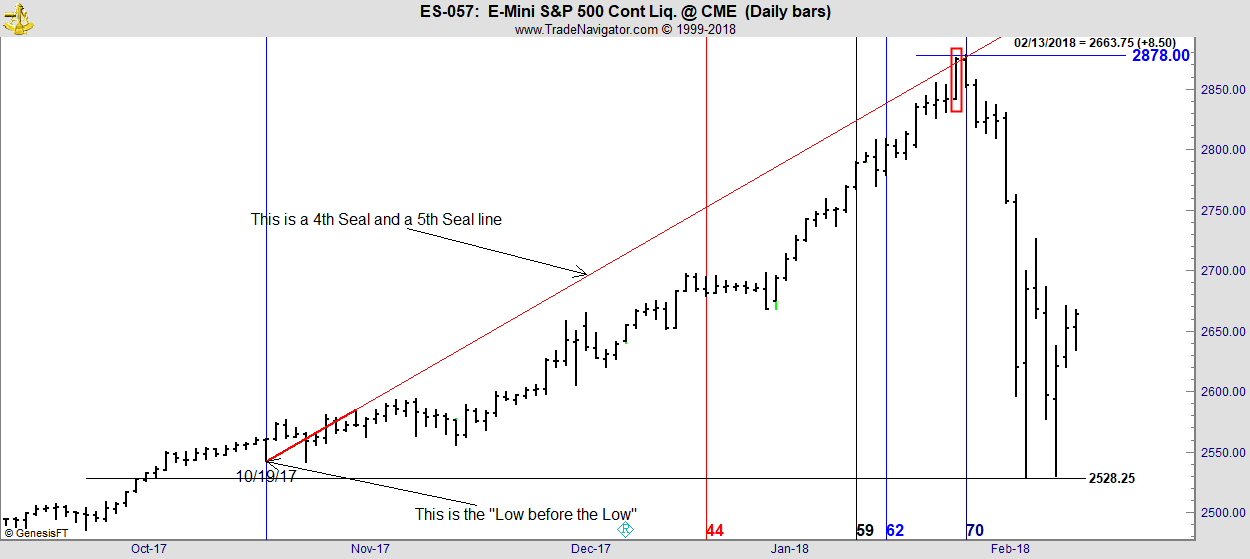
As the market moves on it becomes clear that 2878 is the next target which can be attained either at the bar high or on a daily close. At the close Friday this market was within 2 points or 8 ticks of its next target. That in itself is not unusual, Markets know and seek out these DC numbers and we frequently see markets just ticking off one DC number after another. Friday’s (01/26) high was just 8 ticks off target in a number that has 11,504 ticks and is hence sitting at a variable of just 0.069% from target, well within our allowable variance, so at the close of Friday’s trading we had potential target recognition but that alone does not create reversal signals. You can see this DC target recognition on the next chart:
Importantly last Friday’s (01/26) high in the red box was also at a 4th and 5th Seal line. This made it far more interesting. 4th and 5th Seal lines are Angles and hence have elements of both Time and Price. This 4S and 5S line started from the minor low of 10/19/17. I have added it to the following chart:
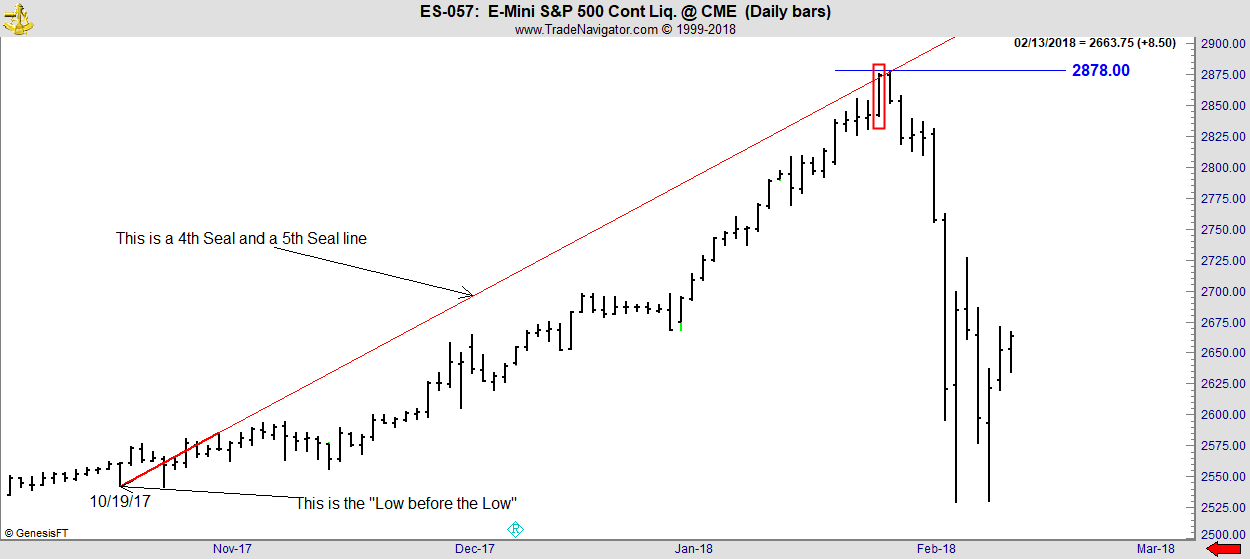
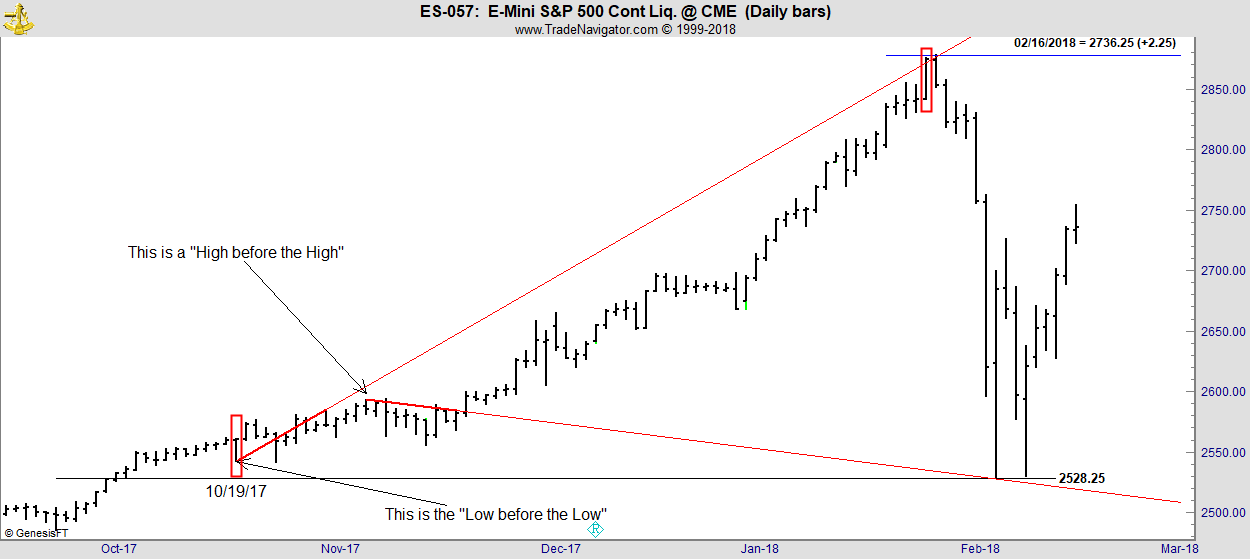
A 4th Seal or 5th Seal line drawn from the Low before the Low will forecast a future High. In the same way a downward sloping 4th or 5th Seal line drawn from the High before the High well forecast future Lows. It’s hard to see on this chart but the 10/19/17 low which originates this Angle is a higher low than its successor on 10/25 thus creating the essential characteristic of a Low before the Low. Now we have some of the ingredients for a reversal. Nothing in the Danielcode daily signals speaks to quantum but always being on the right side of the market together with our various stop loss protocols ensure you are in for both the big and the small moves.
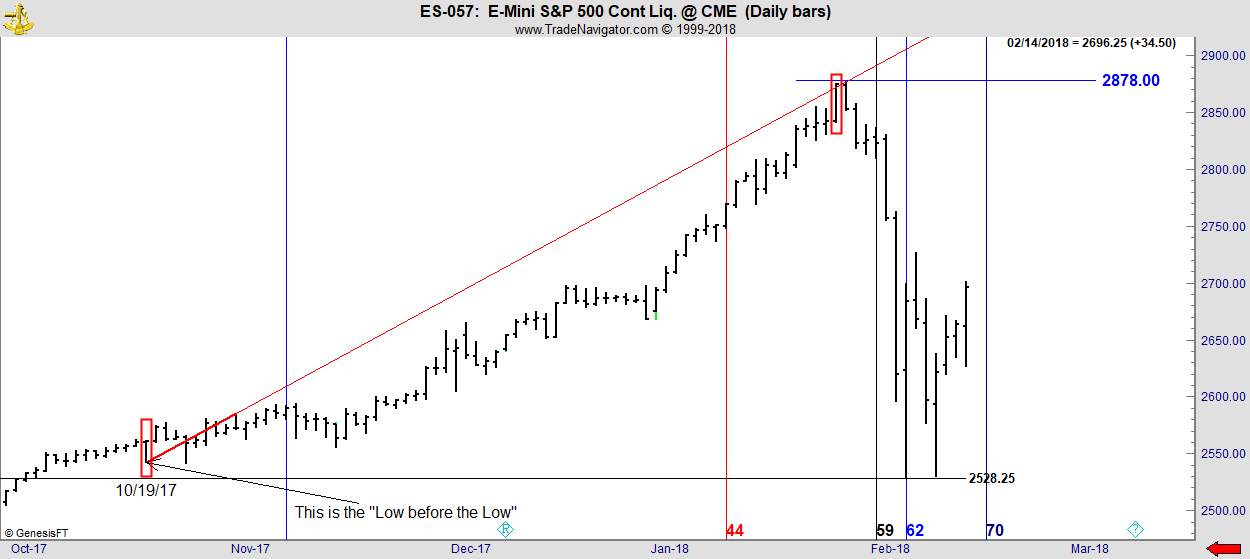
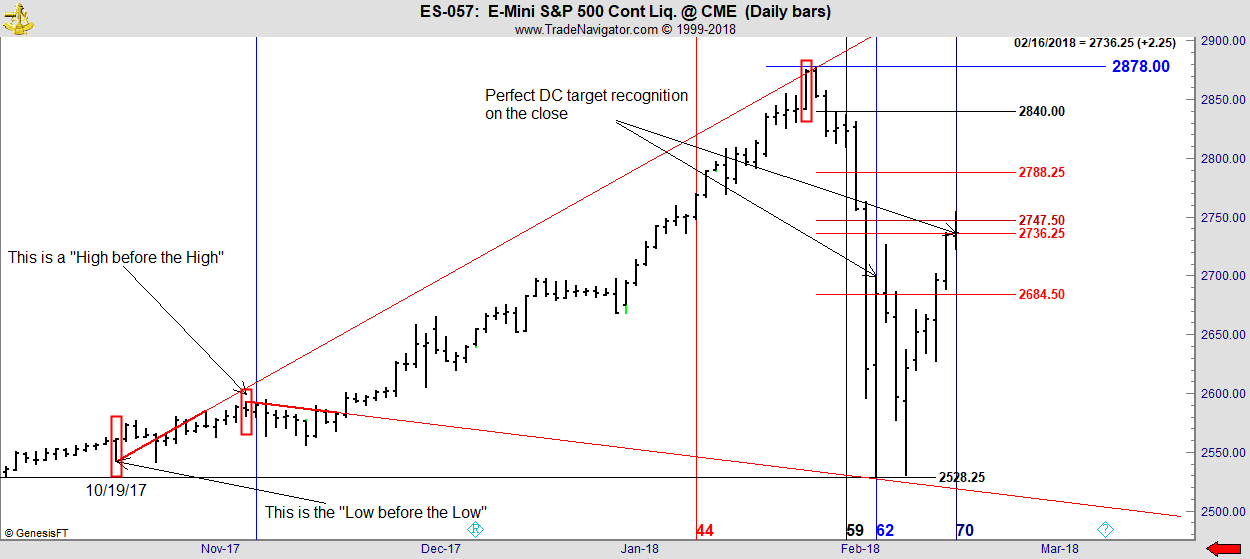
Having identified 10/19/17 as an important low due to its import as the originating bar for our 4S and 5S Angle, it behoves us to add the major DC Time cycles originating from that Low. You can see them on the following chart:
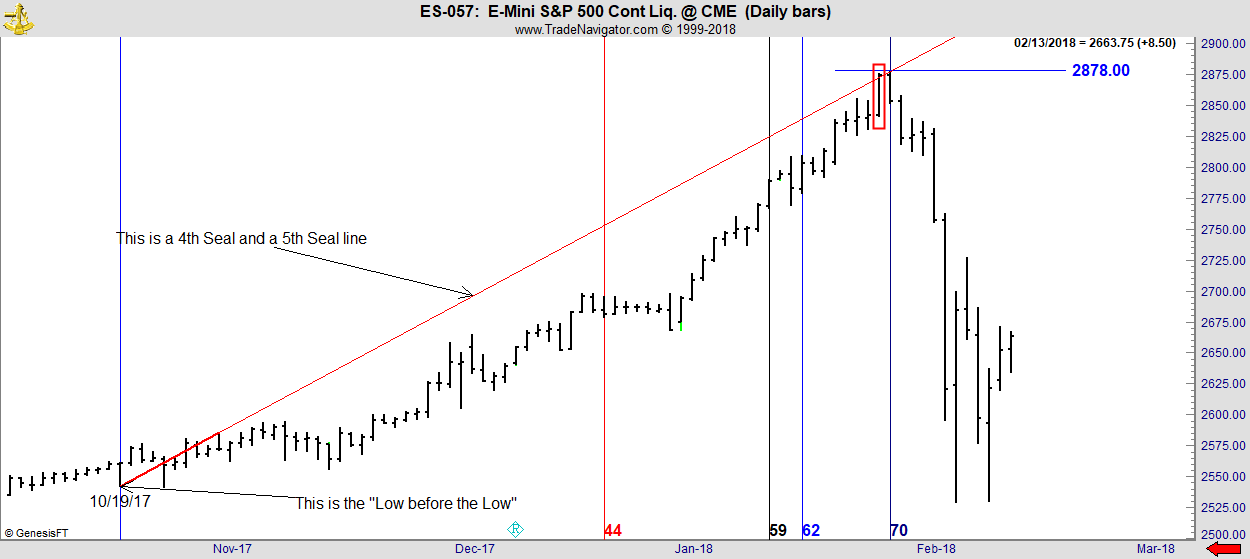
We call the 70 cycle the “Heathen” cycle. In truth there is nothing heathen about it. The number 70 is in particularly good standing but comes from a different part of the Book of Daniel to the more dominant DC Time cycles but was much favored by the father of modern science Sir Isaac Newton who published “Observations upon the prophecies of Daniel” in 1733. It’s available on the net for those who seek knowledge.
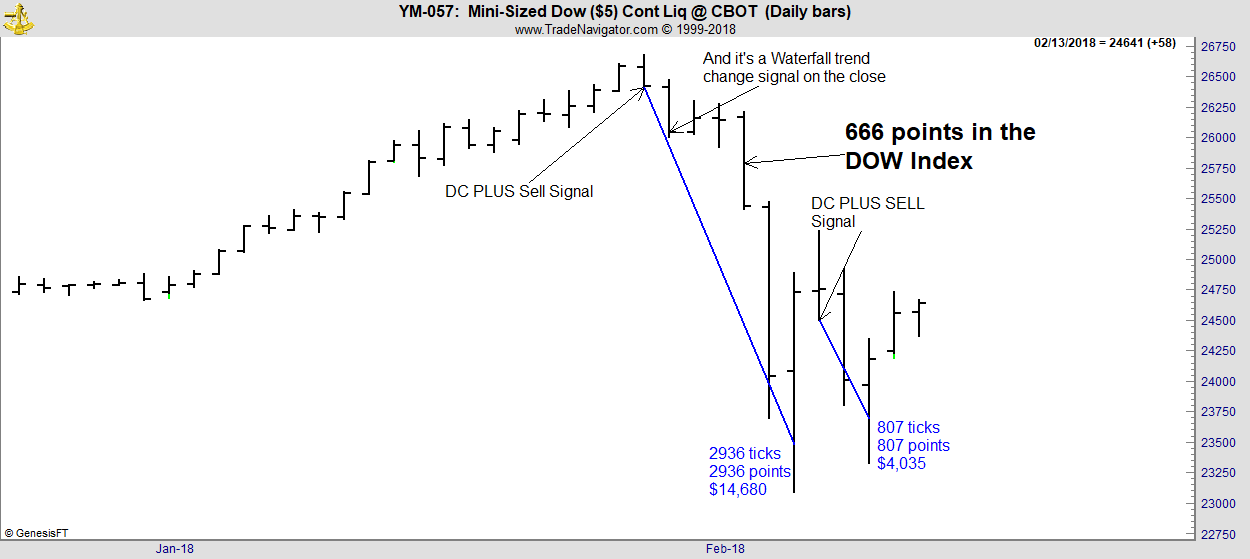
The DC Time cycles can originate from either a chart Low or the closing Low immediately prior and hence we expect these Time cycles to be valid for +/- 1 period only. On Monday 01/29 the market opened and pushed up to 2878.50 now just 2 ticks from target and perfected the 70 day Time cycle expiration. This led to our issuing PLUS Sell signals to our Members at 7:30PM USET on Monday evening valid for trading the next day. These Sell signals were posted for DOW, S&P and NASDAQ. Time and Price were indeed Squared, and as I have written elsewhere on numerous occasions. when Time and Price are Squared a turn is almost inevitable.
Time is the most little known but certainly most misunderstood function of markets. Indeed Time creates a whole suite of stand-alone signals but when combined with Price is especially deadly! For those of you interested in the concepts of trading Time I invite you to read my articles “Master Class I-It’s About Time” and “Master Class II-Timing Gold”, both available under the Articles tab at our website www.thedanielcode.com .
To add piquancy to the mix, Dow accelerated out of its PLUS Sell signal to fall 666 points in the index on 02/02. This ominous number described as “The Mark of the Beast” in Revelations:13 has the power to both Buy and Sell. Here we saw the Sell side just as we saw the Buy side at 666 in the S&P way back in March 2009! The great king Solomon tells us in Proverbs that “What has been, will be again” and so we see these patterns and Time and Price being Squared at all important market junctures.
The Dow chart is below.
Importantly all the US Equities indices in responding to their respective PLUS Sell signals furnished immediate trend change signals by electing their waterfall patterns on 01/30. This told us to stay with the new downtrend within our normal trading rules. Volatility is the great gift to Futures traders, and whilst it has been conspicuously absent of late, probabilities are that vol begets more vol. Let’s hope that is so.
So where to from here? The S&P has so far been just correcting the swing to the 9/25/17 low. And we know that with a degree of certainty as the lows almost perfectly found the famous DC Black line, the last point of support or resistance in any swing at its lows of 2/06 and retest on 2/09. A close below this Black line signals that swings of greater range will be selected or for more abundant clarity it well be going much lower folks!!
Now that we know 10/19/17 is a pivotal date controlling current DC Time cycles we can begin to explore the other highs and lows close by, expecting that cycles from Lows will show future Highs and related Highs well show future lows although they can reverse. The low of 11/02/17 used as a start point for our Time count puts the 59 DC period right at the swing High on 01/26/18. This is the closing High although the next day 01/29 is the actual chart high. As I told you earlier, DC target recognition of Price can occur at either a bar High/Low or in the close. In the same way Time target recognition can happen on either the bar High or the Close. Both are valid.
Starting our Time count from the low of 11/15/17 gives us a 59 down bar on 02/07 and 1 bar past the turn the previous day and the 62 which generally gives us Lows provides support for the fragile up bar of 02/13. This defines the range of the current controlling Time cycles as running from our start date on 10/19/17 to the low on 11/15/17 and that means we can start using any minor swing High in that period to forecast future Lows. 11/08/17 is the closing High of this entire period so we can start our major DC Time cycle count there and see what is revealed:
Now we get the 62 DC cycle, usually associated with lows hitting right on 02/06 the immediate low of the selloff, AND we have a known DC Price target at the Black line at 2528.25. So we have Time at a known DC level and Price also at a known DC level but on the other axis. Ergo we have Time and Price Squared at this low and have again discovered Ping! And if we truly have Time and Price Squared at the 2528 low, we should also see a 4th or 5th Seal at that point, and here it is:
The retest of the 2528 comes on the 70 day cycle and the subsequent three days of Price action shows a rally underway and that means that this market should start ticking off the Danielcode retracement numbers. We saw on 02/06 that this market found its DC retracement number of 2684.50 on the close (keep thinking DC target recognition is valid on the bar High/Low or on the Close) so that bar’s close at 2684.50 told us precisely which swing was being corrected and confirmed how accurately the Danielcode numbers control all markets in all time frames. This happens in all organized markets. So we again have Time and Price squared at the 02/06 close as this is the bar on which the DC 62 cycle expires and we have Price recognition on the close. These are the conditions precedent for a turn, and accordingly we issues another PLUS Sell signal for the Dow for trading on 02/08 which was elected that day as the Equities ran down for their retest of the Lows.
US Equity markets are so correlated that a DC trade signal for any one of Dow, NASDAQ, S&P and Russell can be executed in any other correlated market is the trade is elected.
The next number up in the DC retracements is 2736.25 and this is a particularly strong number as it is twice Time. Thursday 02/15 obliged by making its High at 2736.75 and Friday was even more specific making its close at 2736.25 for target recognition with zero variance. Markets are trying to talk to us constantly and this is the market’s way of saying “I know these DC numbers and I am tracking them”.
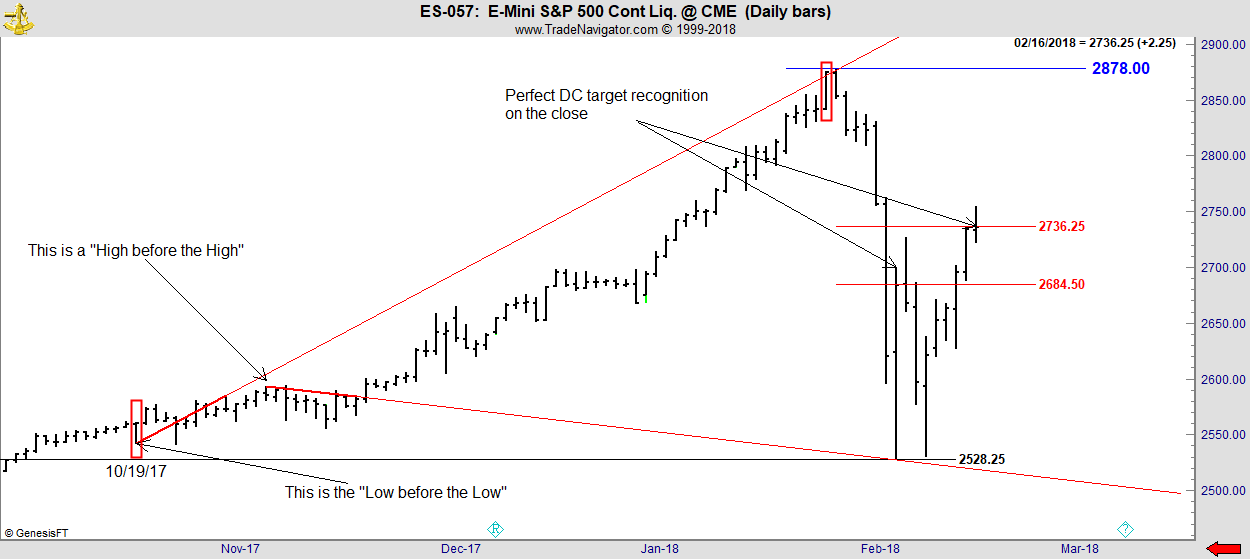
If we examine the 11/08/17 bar which initiated the 4th Seal line that delineated the flash crash low we can see that it is actually the closing high of that swing and hence another point from which we can start our Time count. and starting from that closing High gives us the 70 day cycle expiring on 02/16 and is a byproduct of the 62 day cycle expiring at the dominant Low. You have seen this in an earlier chart but here it is again complete with the DC retracements which are operative in the present rally. If you have followed this argument so far you well realise that Friday too has found its DC target in Price and is sitting on the valid 70 day cycle which the flash crash Low has set up for us. Hence Friday’s close becomes yet another Ping point as we look forward to the coming week’s trading.
Finding Ping sets up probabilities but only probabilities. Like life, nothing is certain on trading markets but by understanding Time and Price we effectively have a 3D and Technicolor view of what is otherwise a bleak grey landscape. And the more we refine our understanding of markets the better we trade. To complicate the current week’s outlook we have a market holiday on Monday for Presidents Day, but Equities will trade electronically for a few hours to muddy the waters.
None of this tells you how to trade the coming week. That is a matter for the DC Trade Signals to resolve, But I trust at the least you can see that when you understand Time and Price analysis, markets are in fact rational and orderly in even the most extreme moves and are bound by the Danielcode. Watch the future levels and follow the DC Trade Signals. They well keep you on the right side of markets.
I trust you have enjoyed this short exposition on the values of Time and Price and the finding of Ping. No search for Beta or Gamma, no after the fact theories of VIX and its derivatives. Just Danielcode charting and clear signals before it happens. And finding Ping at that fabled junction of Time and Price is the ultimate reward.
You are most welcome to join us at the Danielcode website and if you aspire to be an elite trader then a Danielcode Video Tutorial will show you how to do market analysis like this but more importantly it well teach you how to trade Time on a stand-alone basis from daily charts and that my friends is the greatest gift of all.
If you enjoy being on the right side of the markets you are most welcome to join us.
Please visit us at www.thedanielcode.com where there is much to learn.
"The fox knows many things, but the hedgehog knows one big thing. A Hedgehog Concept is not a goal, intention or strategy to be the best. It is an understanding of what you can be best at. The distinction is absolutely crucial". ~ Isaiah Berlin, The Hedgehog and the Fox
Disclaimer: All the reports, charts and content in the Danielcode web site are for educational purposes only and do not constitute trading advice nor an invitation to buy or sell securities. The views are the personal views of the author only and should be treated as such. Before acting on any of the ideas expressed, the reader should seek professional advice from a licensed broker in the appropriate jurisdiction.
Risk Disclosure for Front Page, Long Term Trend Charts: THE RISK OF LOSS TRADING COMMODITIES OR FUTURES CAN BE SUBSTANTIAL. COMMODITY TRADING HAS LARGE POTENTIAL RISKS, IN ADDITION TO ANY POTENTIAL REWARDS. YOU MUST BE AWARE OF THE RISKS AND BE WILLING TO ACCEPT THEM IN ORDER TO INVEST IN THE FUTURES OR COMMODITIES MARKETS. DON'T TRADE WITH MONEY YOU CAN'T AFFORD TO LOSE. THIS IS NEITHER A SOLICITATION NOR AN OFFER TO BUY OR SELL COMMODITY INTERESTS. THE USE OR PLACEMENT OF ANY STOP-LOSS OR STOP-LIMIT ORDERS MAY NOT LIMIT YOUR LOSSES AND YOU COULD LOSE MORE THAN YOUR INTENDED AMOUNT OF MONEY AT RISK. PAST PERFORMANCE OF ANY TRADING SYSTEM OR METHODOLOGY IS NOT INDICATIVE OF FUTURE RESULTS.
Risk Disclosure for Genie Results, T.03, T.03+ and TradeProgram: HYPOTHETICAL PERFORMANCE RESULTS HAVE MANY INHERENT LIMITATIONS, SOME OF WHICH ARE DESCRIBED BELOW. NO REPRESENTATION IS BEING MADE THAT ANY ACCOUNT WILL OR IS LIKELY TO ACHIEVE PROFITS OR LOSSES SIMILAR TO THOSE SHOWN; IN FACT, THERE ARE FREQUENTLY SHARP DIFFERENCES BETWEEN HYPOTHETICAL PERFORMANCE RESULTS AND THE ACTUAL RESULTS SUBSEQUENTLY ACHIEVED BY ANY PARTICULAR TRADING PROGRAM. ONE OF THE LIMITATIONS OF HYPOTHETICAL PERFORMANCE RESULTS IS THAT THEY ARE GENERALLY PREPARED WITH THE BENEFIT OF HINDSIGHT. IN ADDITION, HYPOTHETICAL TRADING DOES NOT INVOLVE FINANCIAL RISK, AND NO HYPOTHETICAL TRADING RECORD CAN COMPLETELY ACCOUNT FOR THE IMPACT OF FINANCIAL RISK OF ACTUAL TRADING. FOR EXAMPLE, THE ABILITY TO WITHSTAND LOSSES OR TO ADHERE TO A PARTICULAR TRADING PROGRAM IN SPITE OF TRADING LOSSES ARE MATERIAL POINTS WHICH CAN ALSO ADVERSELY AFFECT ACTUAL TRADING RESULTS. THERE ARE NUMEROUS OTHER FACTORS RELATED TO THE MARKETS IN GENERAL OR TO THE IMPLEMENTATION OF ANY SPECIFIC TRADING PROGRAM WHICH CANNOT BE FULLY ACCOUNTED FOR IN THE PREPARATION OF HYPOTHETICAL PERFORMANCE RESULTS AND ALL WHICH CAN ADVERSELY AFFECT TRADING RESULTS.