Merry Christmas and a happy and healthy New Year to all Danielcode members. It is a cloudy Christmas afternoon in Belgium when I write this and I just realized that it has been a decade since I was first exposed to the Danielcode. 2 years later I did my first tutorial in 2011 in New Zealand where I gained my first real insight into how markets work. In this article I’m going to analyze equities from a Danielcode perspective and at the end I will decipher with you what the Danielcode is trying to tell us about the future.
What is the Danielcode ?
The Danielcode is a mathematical sequence of numbers hidden in the book of Daniel in the old testament discovered by our mentor John Needham. How these numbers are calculated is beyond the scope of this article. You can discover all about these numbers on the thedanielcode.com/display.php?nav=articles page. There is also a very interesting “Live at the Springs” audio which will explain you where these numbers come from. I encourage you to read these articles and listen and watch the audios and videos. If you really want to understand how and why markets do what they do you have found the only and true holy grail. But you are not there yet. If you decide to read on you will have to open up your mind and believe. Only then you will see the enormous potential and importance of these numbers. The good news is that those who believe will soon be rewarded with the mathematical proof that these numbers are for real and that they are the most important ratios of the universe that define all life and death.
Current state of equity markets
For the equity markets we use the SPX as a proxy. Since the rest of the world pretty much follows what happens in the US we use the SPX analysis to read the global equity situation. Below you can see the monthly chart of the SPX. Monthly charts in the Danielcode are constructed with bars that contain 24 trading days. Why 24, 12 and 6 day bar charts are important for the DC is described in the many articles on the DC website.
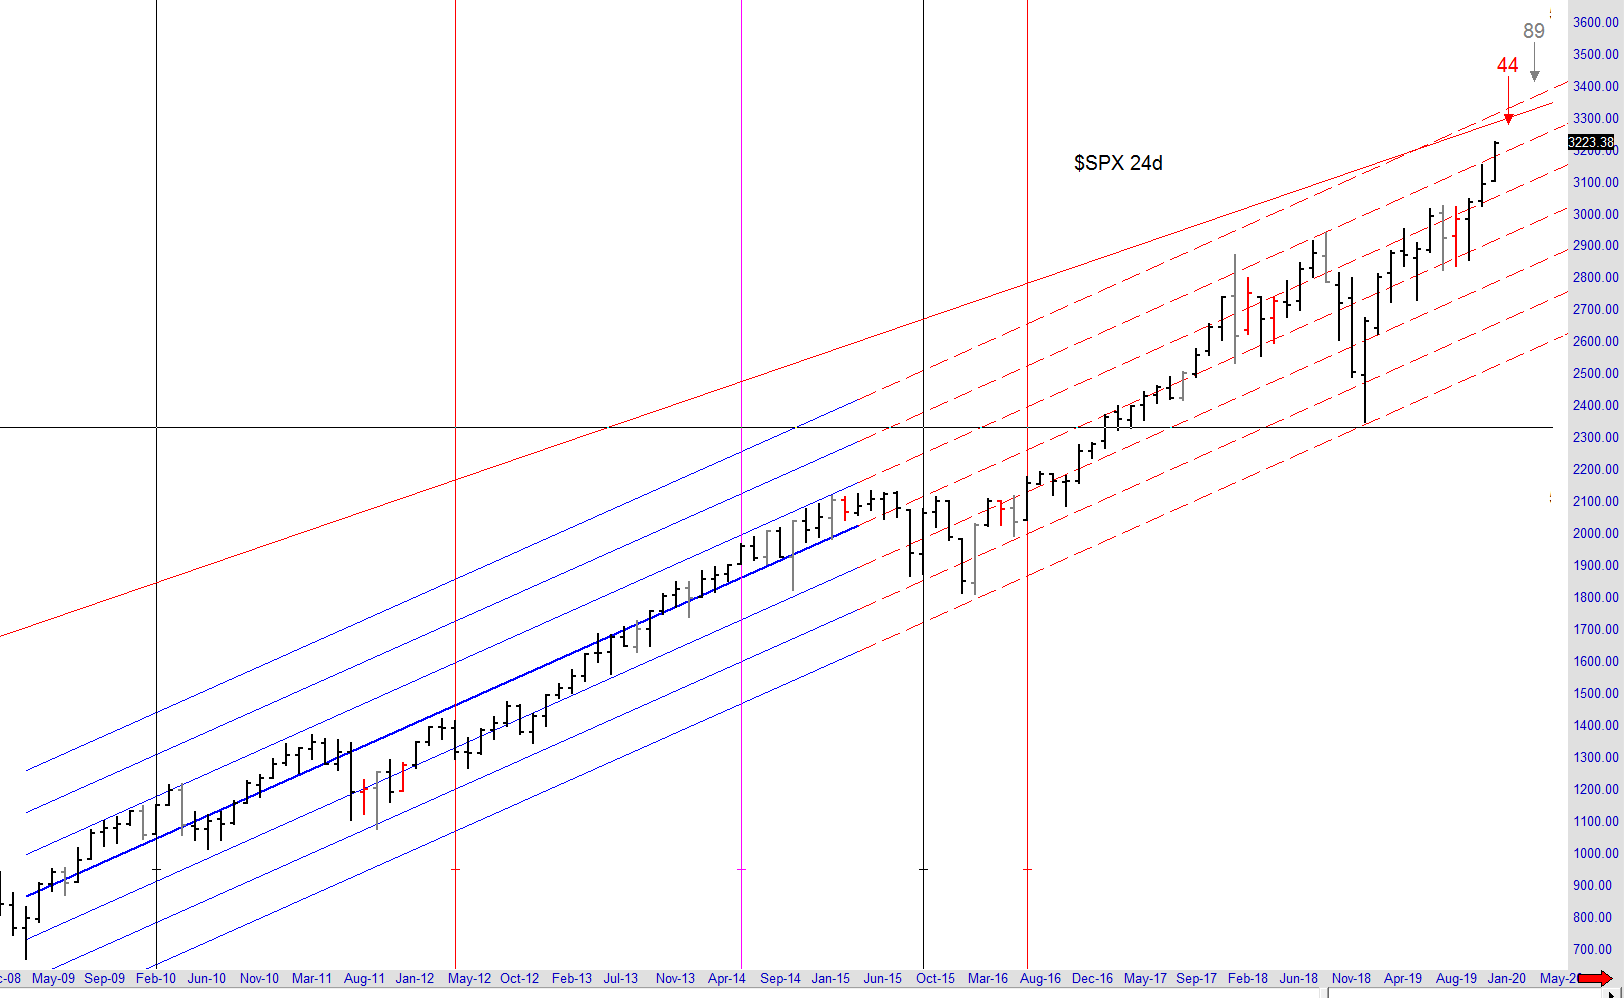
I think it’s fair to say that the rally since the March 2009 has been very impressive. The channel you see on this chart is a Danielcode regression channel constructed by the DC ratios. If you look closely you will see that this market was contained by 3 standard deviations of the mean of this channel both up and down. The SPX is now moving towards the 3rd standard deviation of this channel and I suspect the current rally will get us there. The slope of the rally since the March 2009 low is steep. Equities are in a strong bull market. The points where the SPX makes a turn is where a Danielcode time cycle hits together with DC price level that this market hits. When time and price meet each other on the Daniellcode matrix a turn is almost inevitable. You can see a more detailed chart below.
When time and price are squared we might get a major turning point or just a vibration in the market. We cannot predict momentum of the turn. It might be a big turn or just a small correction after which the original trend resumes. Both however are very interesting from a trading perspective. If you are looking for big turns (major lows or highs) tools like DC regression analysis help. For instance once a market is at 3 standard deviation from the mean of the longer term trend it is likely that when the next DC time cycle hits you can expect a major turn. The upper and lower band of a regression channel together with the median are always important price levels to watch especially when a DC time cycle hits.
As traders we need predictive insight on major market turns as it allows us to protect existing positions with tight stops while preparing for a position on the other side. Danielcode time cycles get us on alert for when we need to get ready while the daily DC website signals actually pull us into the trade. But also the minor vibrations in price when a DC time cycle expires are interesting. We might get pulled into a trade that is countertrend and short lived, sometimes even loosing, but as soon as the price level where the Danielcode time cycle did hit is exceeded we know the original trend is back on which again gives us the info we need regarding position and stops.
Longer term analysis of the SPX
Let’s start with the 48 trading chart. Every bar on this chart contains 48 trading days which is around 2 months. We have a clear view on the 2000 and 2007 bull markets and the corrections that followed. The current bull market is epic in proportion compared to the previous ones.
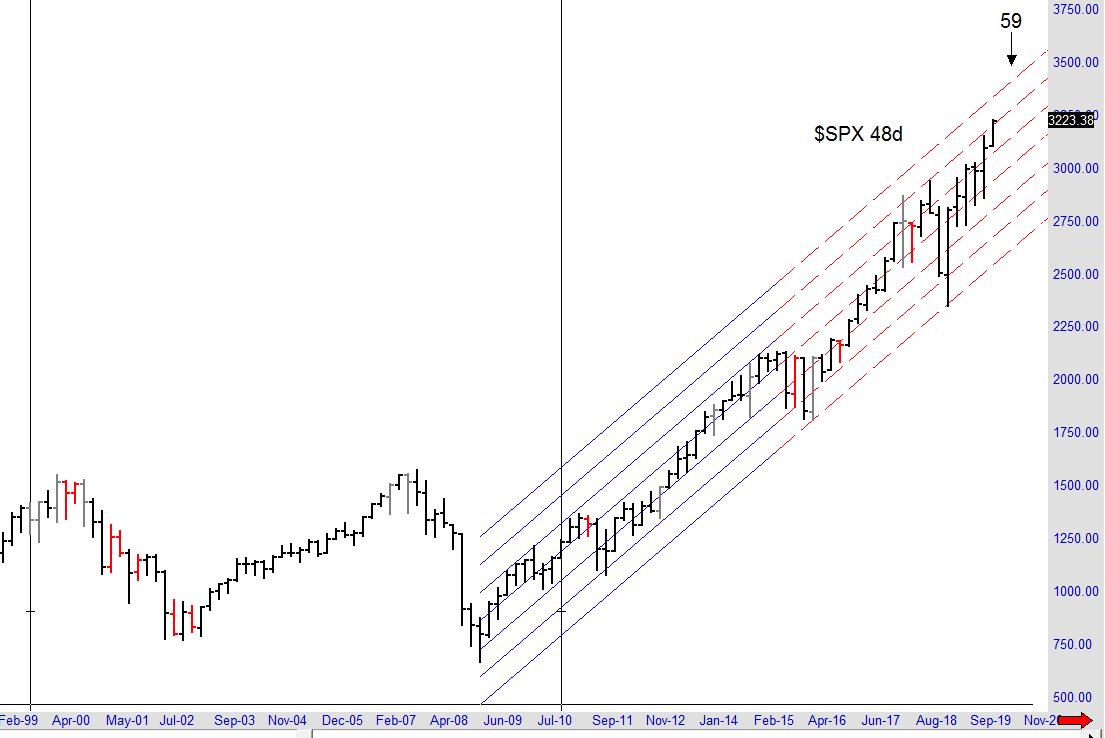
To cap this rally we need a 59 cycle. More particular we need a 59 death cycle which is the first expiration of a 59 cycle. Looking at the 48 day chart the first 59 cycle that comes along starts to bite on 4/16/2020. But looking a little deeper we notice that this cycle originates from the March 09 low which means this is not a valid death cycle. Odds therefore are not very high that this will be the cycle that caps this bull market rally. In fact since it comes form a low it could also give us the next major swing low. The following 59 on this chart that comes along is a valid 59 death cycle and is scheduled for around May 2021.
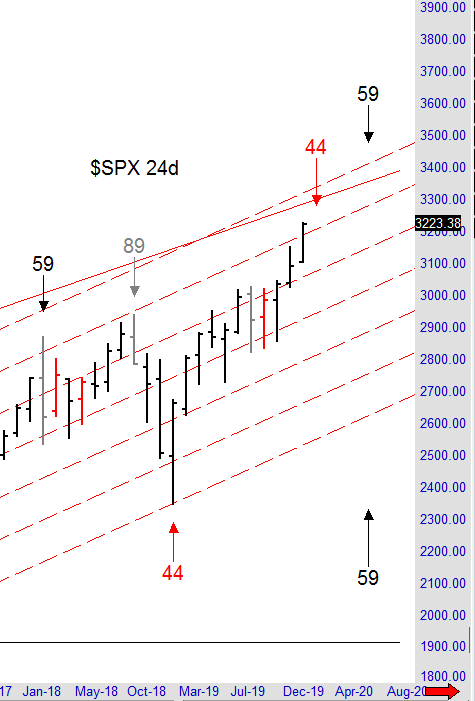
Scaling down in time we switch to the 24 trading day chart which is the monthly chart in the Danielcode. You can see this chart in the previous paragraph. Here we see a 44 cycle top that starts to bite on 1/7/2020. This is a very interesting cycle which I will explain deeper in the 4th Seal updates but 44 cycles usually just give us short term tops, not a major high that ends a bull market. The next 59 cycle on this chart expires on 5/20/2020 but also that one does not qualify as a 59 death cycle. In fact the SPX has very few 59 cycles for the months ahead on this chart. This does not mean it cannot correct to lower levels, it just means that whatever correction comes it will likely be followed by another rally to new highs. The first 59 cycle top that qualifies as a 59 death cycles comes in late May 2021. Interesting.
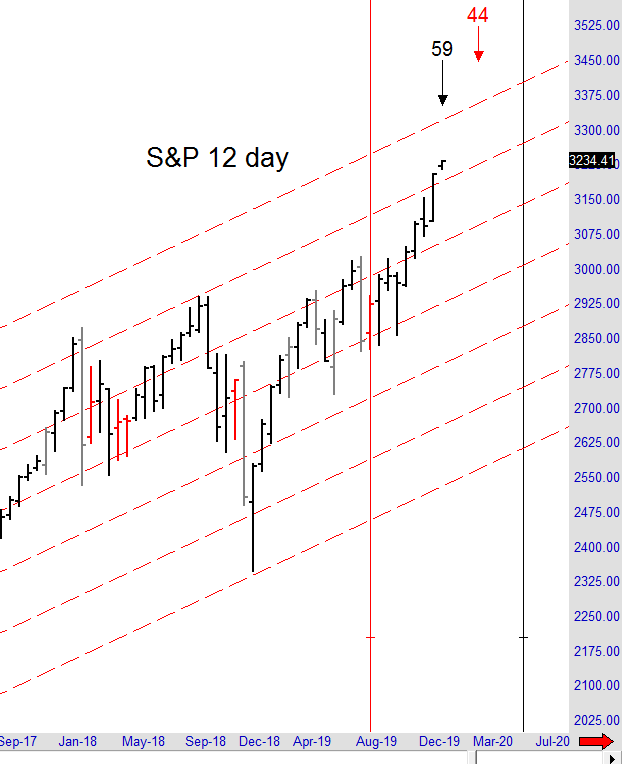
Another level down and we are looking at the 12 day chart. You can find this chart on the next page. There we have a 59 cycle top running right now that ends on 1/6/2020. Not a death cycle but good enough for a correction. We should therefore be on alert for a DC sell signal that could pull us into a short trade. Remember that these cycles can project a swing high or a closing high so you have to give them a few days beyond the end of the cycle to clear the danger of a correction. As strong as this market is right now I suspect the SPX will touch the 3rd standard deviation of that DC regression channel in 2020. Newton’s law of action - reaction is universal. But as long as we are in the cycle window we remain on alert for sell signals posted on the Danielcode website. Especially the T03 signals are truly impressive. They are the only true time signals that predict market turns ahead of the game and with stunning precision.
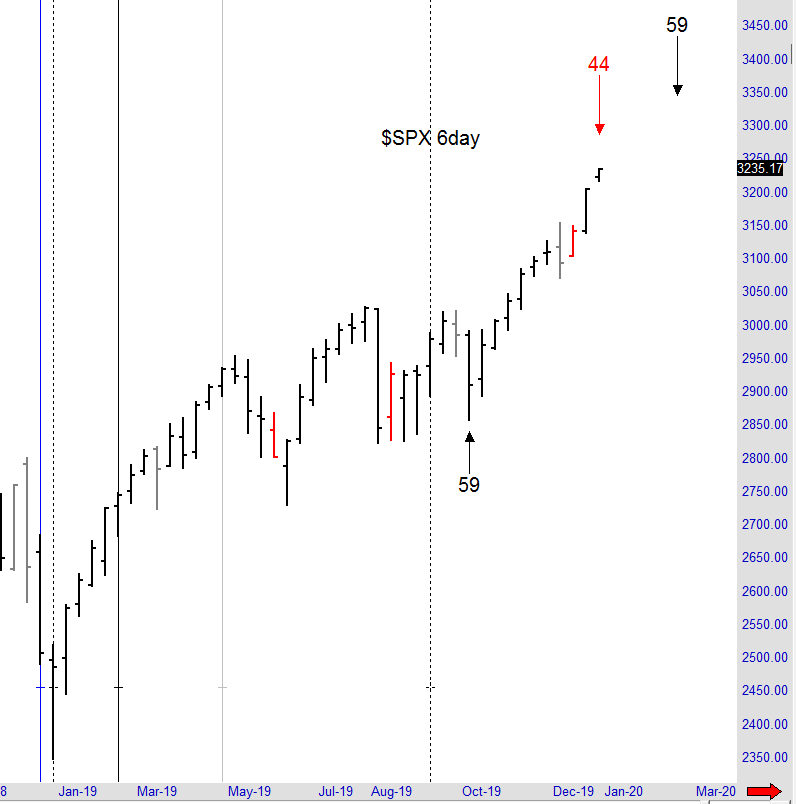
Another level lower and we are down to the weekly chart where every bar is 6 trading days. The 44 cycle now running should be harmless for the bull market but there are a few 59 cycles on this chart to watch for in 2020. There is a 59 cycle top scheduled for 2/10, one for 9/7 and one for 11/30. Strictly judged they qualify as 59 death cycles or cycles that end major bull markets. However major highs are usually also accompanied by a 59 death cycle on the monthly chart which is not the case for 2020.
Summary
What is happening in the global financial system these days is pure madness. Global interest rates are kept close to the floor or even negative and central banks flood markets with mountains of liquidity. Sometimes that is not even enough as the September REPO debacle showed us. But no worries as every small fire is put out with even more liquidity. And the liquidity plows itself a way towards yield or profit. Today that is mainly in bonds and stock which is why the steep rise in these markets. Many experts whom I respect a lot say it is going to end in disaster. Some very respectable financial experts even say that in 2020 the chickens will come home to roost.
Their opinion is a warning as they know what they are talking about. However there is a universal truth we must never forget. Markets are ruled by the Danielcode. Markets move within the boundaries of Danielcode numbers and make turns on Danielcode time cycles. The Danielcode is the only system I know of that has any predictive value on markets. If we want to know what is ahead we have to listen what it is telling us. Markets are perfectly mathematically organized by the Danielcode numbers and even perfectly predictable. The only limitation that the Danielcode has in forecasting markets is our ability to decipher it.
Looking at the long term charts I see little danger for 2020. The SPX is due for a correction for sure. And I would be very careful when we hit the 3rd standard deviation of that regression channel. But I do not see a danger for a disaster in the coming new year. The 6 day chart looks more worrisome as there a few 59 cycles to watch for. However I think they will forecast a coming correction rather than the start of a waterfall decline. We will of course analyze deeper in the weekly 4th seal updates next year.
What scares me is 2021. We cannot decipher what the 6 day is forecasting for 2021 as the structure of this market is too far out but looking at the 48 day, 24 day and 12 day chart, 2021 has a solid 59 death cycle coming up for the month of May. This cycle is a clear message from the Danielcode that 2021 could be the year of reckoning. As we approach this cycle more and more info will reveal itself and we will off course be on top of developments as they come.
It is as I told Pharaoh; God has shown to Pharaoh what he is about to do. There will be seven years of great plenty throughout all the land of Egypt, but after them there will arise seven years of famine, and the plenty will be forgotten in the land of Egypt.
Genesis 41:28-30
We live in a time of excess. I fear the moment when the next 59 death cycle hits. We live fake lives of fake wealth which can be taken away from us in a heartbeat when God chooses to. Central banks are not in control. Control is an illusion. Remember, markets are ruled by the Danielcode which are God’s numbers. They always have been, they always will be. And when they tell us something we should listen. Listen with a sense of respect and humility. We cannot change the climate, nor can we control what the market has in store for us. We can only undergo. We are but dust in the wind.
By the sweat of your face You will eat bread, Till you return to the ground, Because from it you were taken; For you are dust, And to dust you shall return.
Genesis 3:19
Isaac Newton knew that there was major knowledge hidden in the Book of Daniel. He too gives us solid warnings.
My best wishes for 2020
Frank De Baere
John Needham is a Sydney Lawyer and Financial Consultant. He publishes The Danielcode Online and writes occasionally on other markets. He lives with his family in Australia and New Zealand. Please visit us at www.thedanielcode.com where there is much to learn.
"The fox knows many things, but the hedgehog knows one big thing. A Hedgehog Concept is not a goal, intention or strategy to be the best. It is an understanding of what you can be best at. The distinction is absolutely crucial". ~ Isaiah Berlin, The Hedgehog and the Fox
Disclaimer: All the reports, charts and content in the Danielcode web site are for educational purposes only and do not constitute trading advice nor an invitation to buy or sell securities. The views are the personal views of the author only and should be treated as such. Before acting on any of the ideas expressed, the reader should seek professional advice from a licensed broker in the appropriate jurisdiction.
Risk Disclosure for Front Page, Long Term Trend Charts: THE RISK OF LOSS TRADING COMMODITIES OR FUTURES CAN BE SUBSTANTIAL. COMMODITY TRADING HAS LARGE POTENTIAL RISKS, IN ADDITION TO ANY POTENTIAL REWARDS. YOU MUST BE AWARE OF THE RISKS AND BE WILLING TO ACCEPT THEM IN ORDER TO INVEST IN THE FUTURES OR COMMODITIES MARKETS. DON'T TRADE WITH MONEY YOU CAN'T AFFORD TO LOSE. THIS IS NEITHER A SOLICITATION NOR AN OFFER TO BUY OR SELL COMMODITY INTERESTS. THE USE OR PLACEMENT OF ANY STOP-LOSS OR STOP-LIMIT ORDERS MAY NOT LIMIT YOUR LOSSES AND YOU COULD LOSE MORE THAN YOUR INTENDED AMOUNT OF MONEY AT RISK. PAST PERFORMANCE OF ANY TRADING SYSTEM OR METHODOLOGY IS NOT INDICATIVE OF FUTURE RESULTS.
Risk Disclosure for Genie Results, T.03, T.03+ and TradeProgram: HYPOTHETICAL PERFORMANCE RESULTS HAVE MANY INHERENT LIMITATIONS, SOME OF WHICH ARE DESCRIBED BELOW. NO REPRESENTATION IS BEING MADE THAT ANY ACCOUNT WILL OR IS LIKELY TO ACHIEVE PROFITS OR LOSSES SIMILAR TO THOSE SHOWN; IN FACT, THERE ARE FREQUENTLY SHARP DIFFERENCES BETWEEN HYPOTHETICAL PERFORMANCE RESULTS AND THE ACTUAL RESULTS SUBSEQUENTLY ACHIEVED BY ANY PARTICULAR TRADING PROGRAM. ONE OF THE LIMITATIONS OF HYPOTHETICAL PERFORMANCE RESULTS IS THAT THEY ARE GENERALLY PREPARED WITH THE BENEFIT OF HINDSIGHT. IN ADDITION, HYPOTHETICAL TRADING DOES NOT INVOLVE FINANCIAL RISK, AND NO HYPOTHETICAL TRADING RECORD CAN COMPLETELY ACCOUNT FOR THE IMPACT OF FINANCIAL RISK OF ACTUAL TRADING. FOR EXAMPLE, THE ABILITY TO WITHSTAND LOSSES OR TO ADHERE TO A PARTICULAR TRADING PROGRAM IN SPITE OF TRADING LOSSES ARE MATERIAL POINTS WHICH CAN ALSO ADVERSELY AFFECT ACTUAL TRADING RESULTS. THERE ARE NUMEROUS OTHER FACTORS RELATED TO THE MARKETS IN GENERAL OR TO THE IMPLEMENTATION OF ANY SPECIFIC TRADING PROGRAM WHICH CANNOT BE FULLY ACCOUNTED FOR IN THE PREPARATION OF HYPOTHETICAL PERFORMANCE RESULTS AND ALL WHICH CAN ADVERSELY AFFECT TRADING RESULTS.